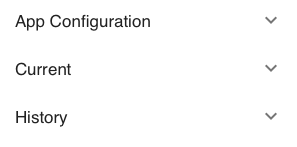
Several dashboards are available under the app’s menu:

Click on it opens it:
Current
Dashboards under the Current menu display the current state.
Overview
This is the default dashboard which is shown when you log into the app.
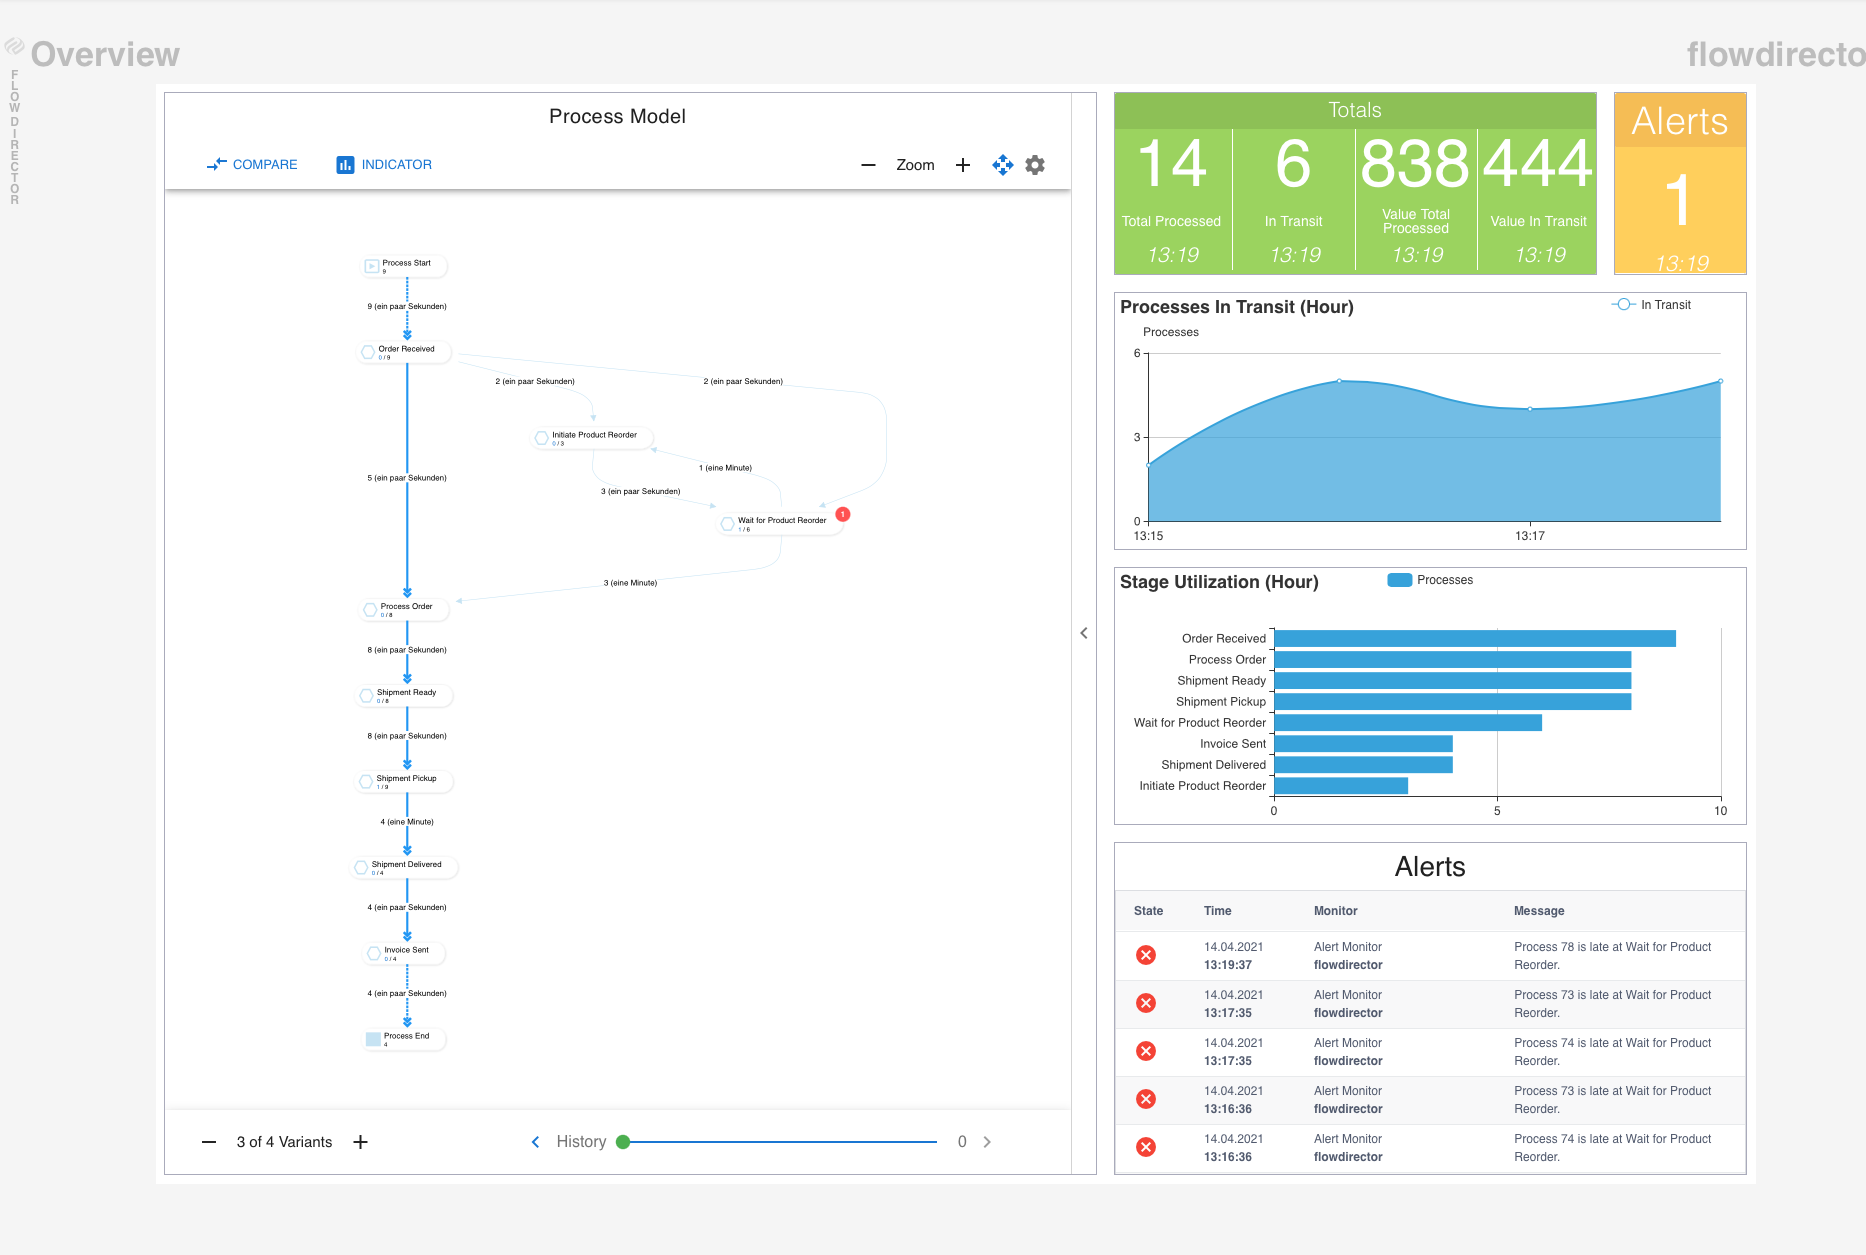
It shows the process model on the left side and statistics on the right side.
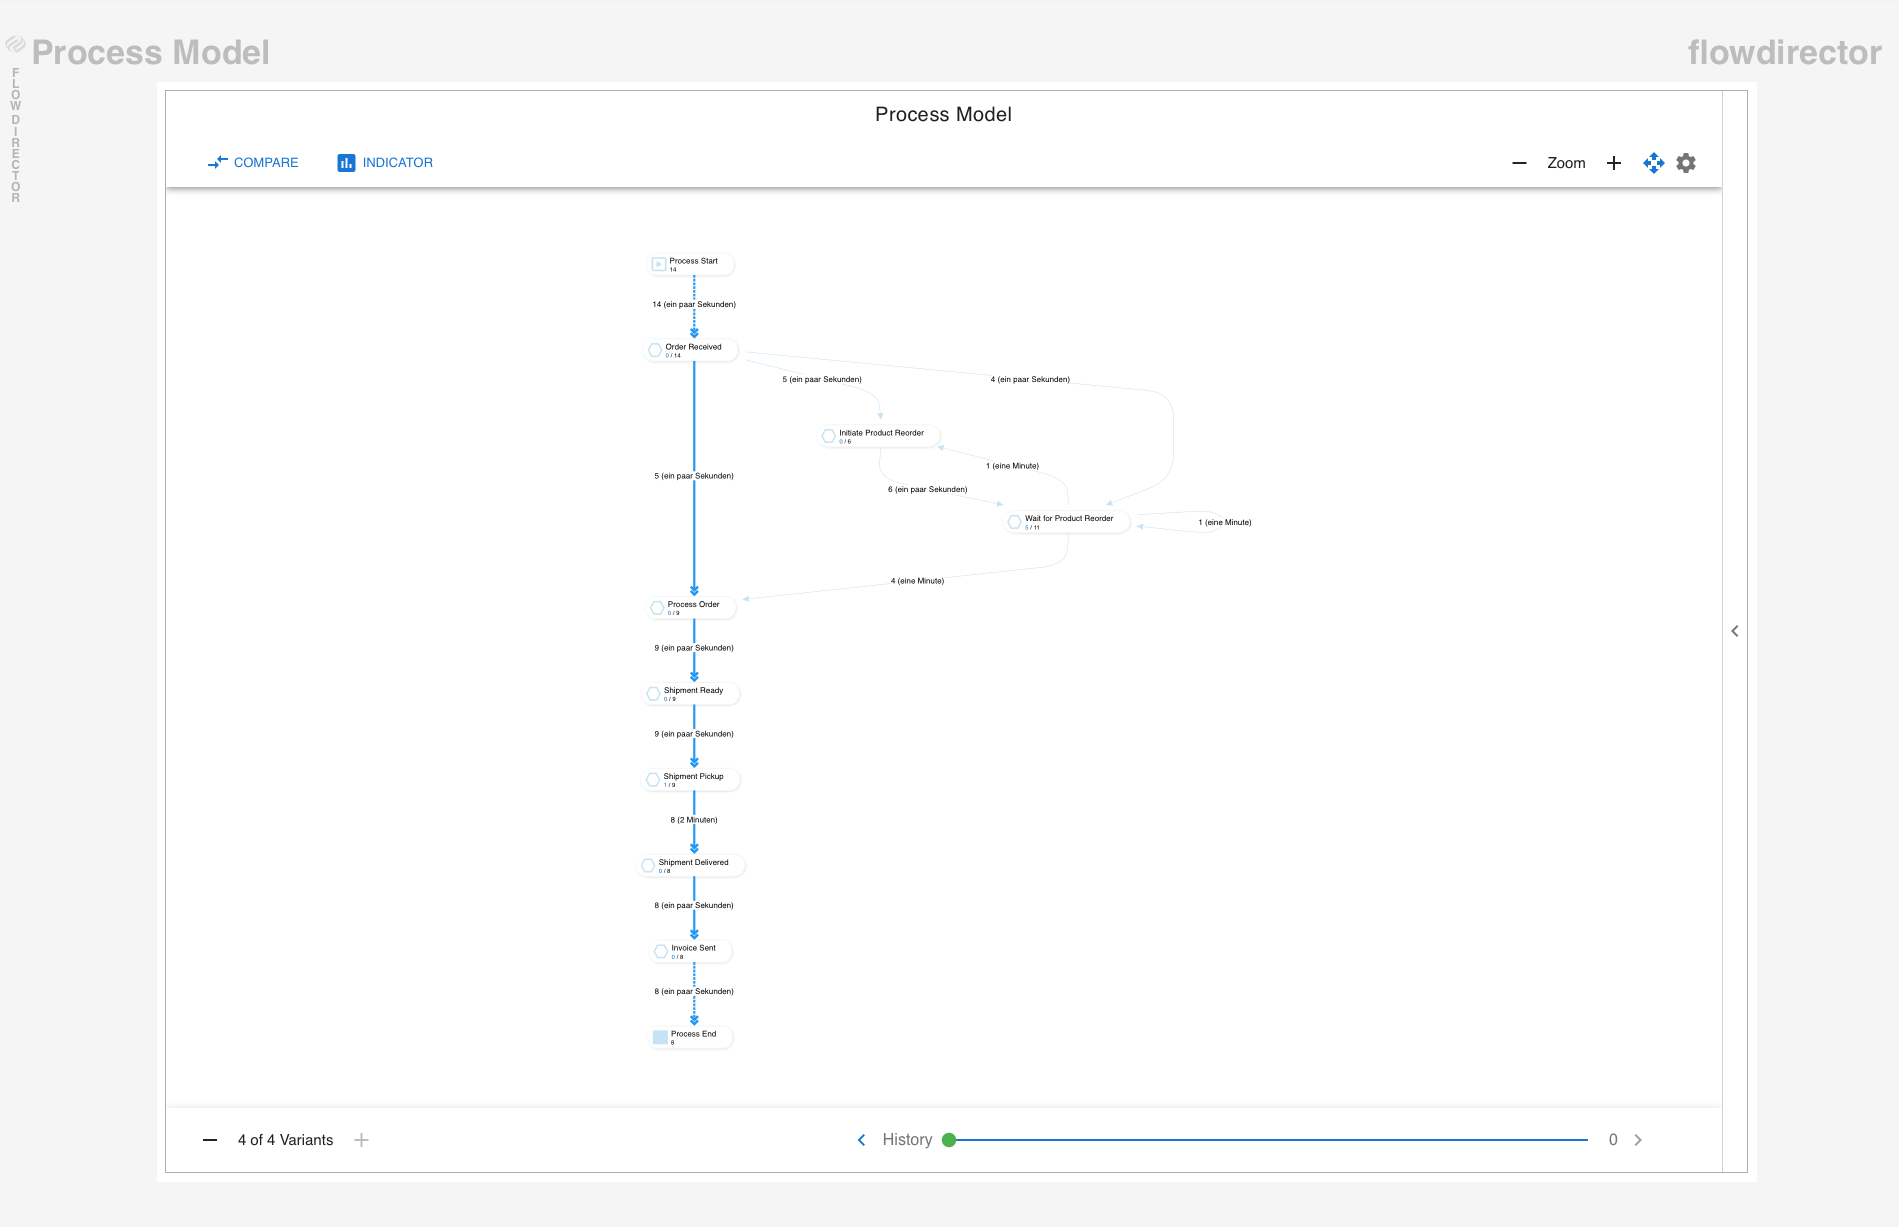
Process Model
This dashboard shows the process model only in case you want to display this and the Statistics dashboard on different screens.
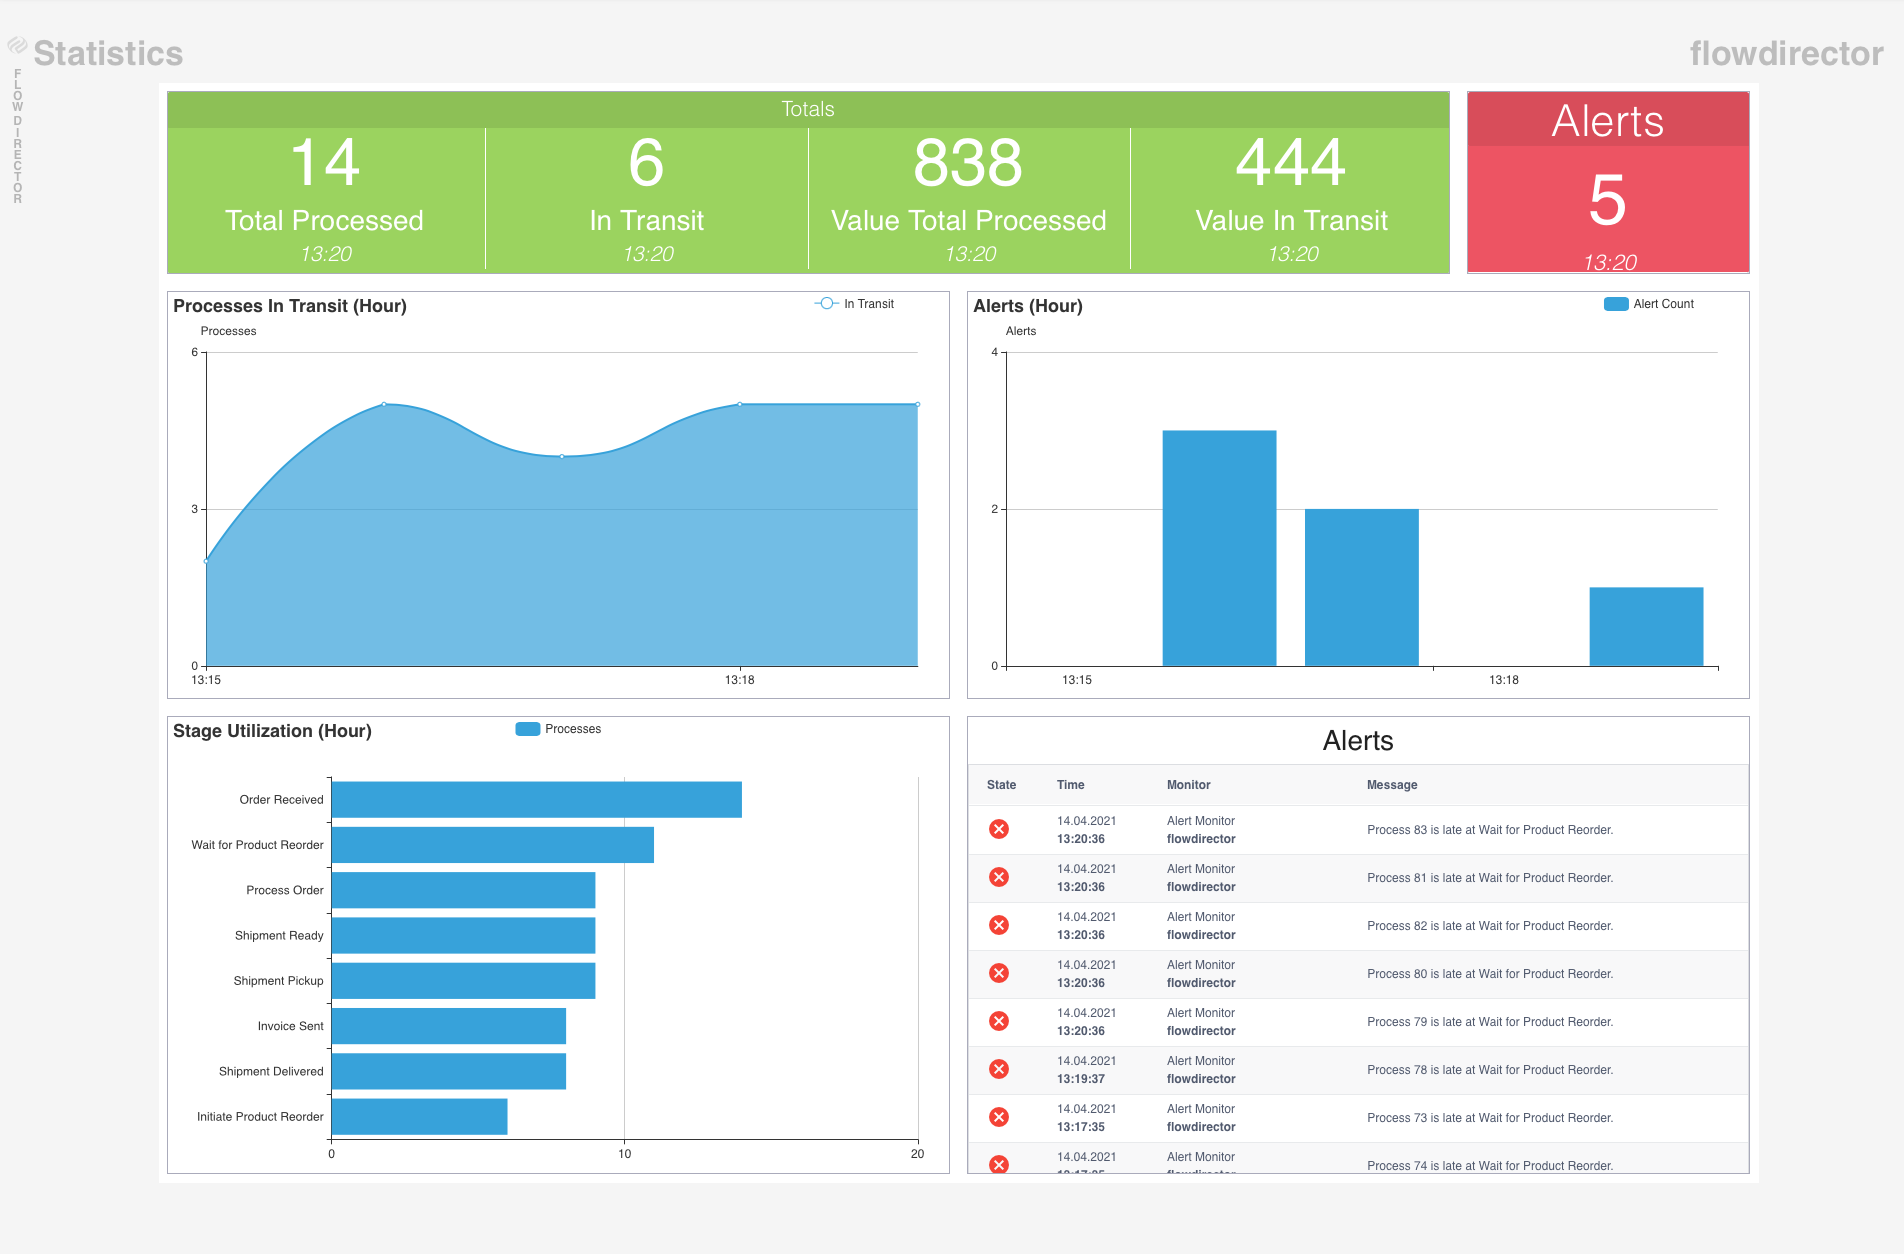
Statistics
This dashboards displays the statistics only in case you want to display this and the Process Model dashboard on different screens.
History
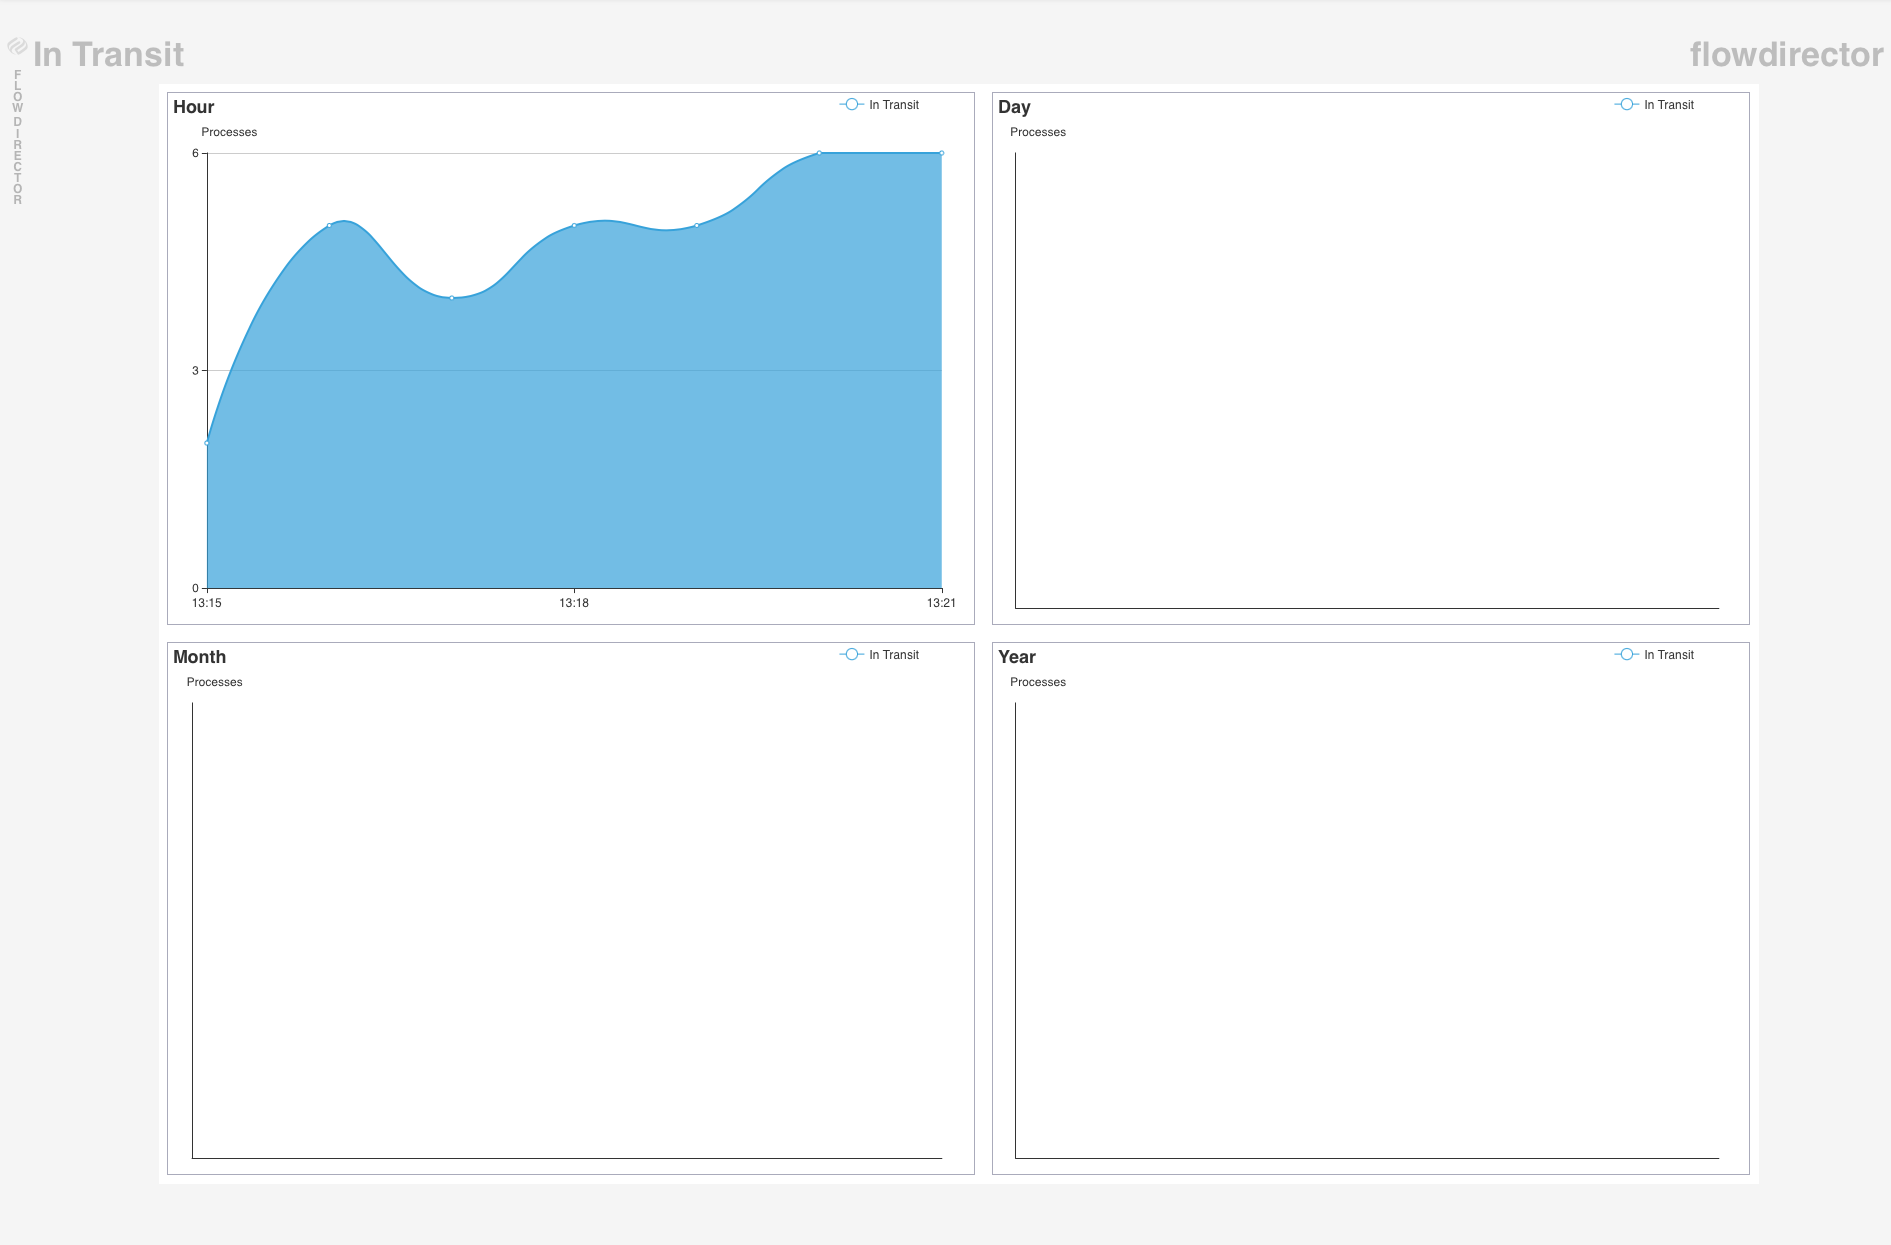
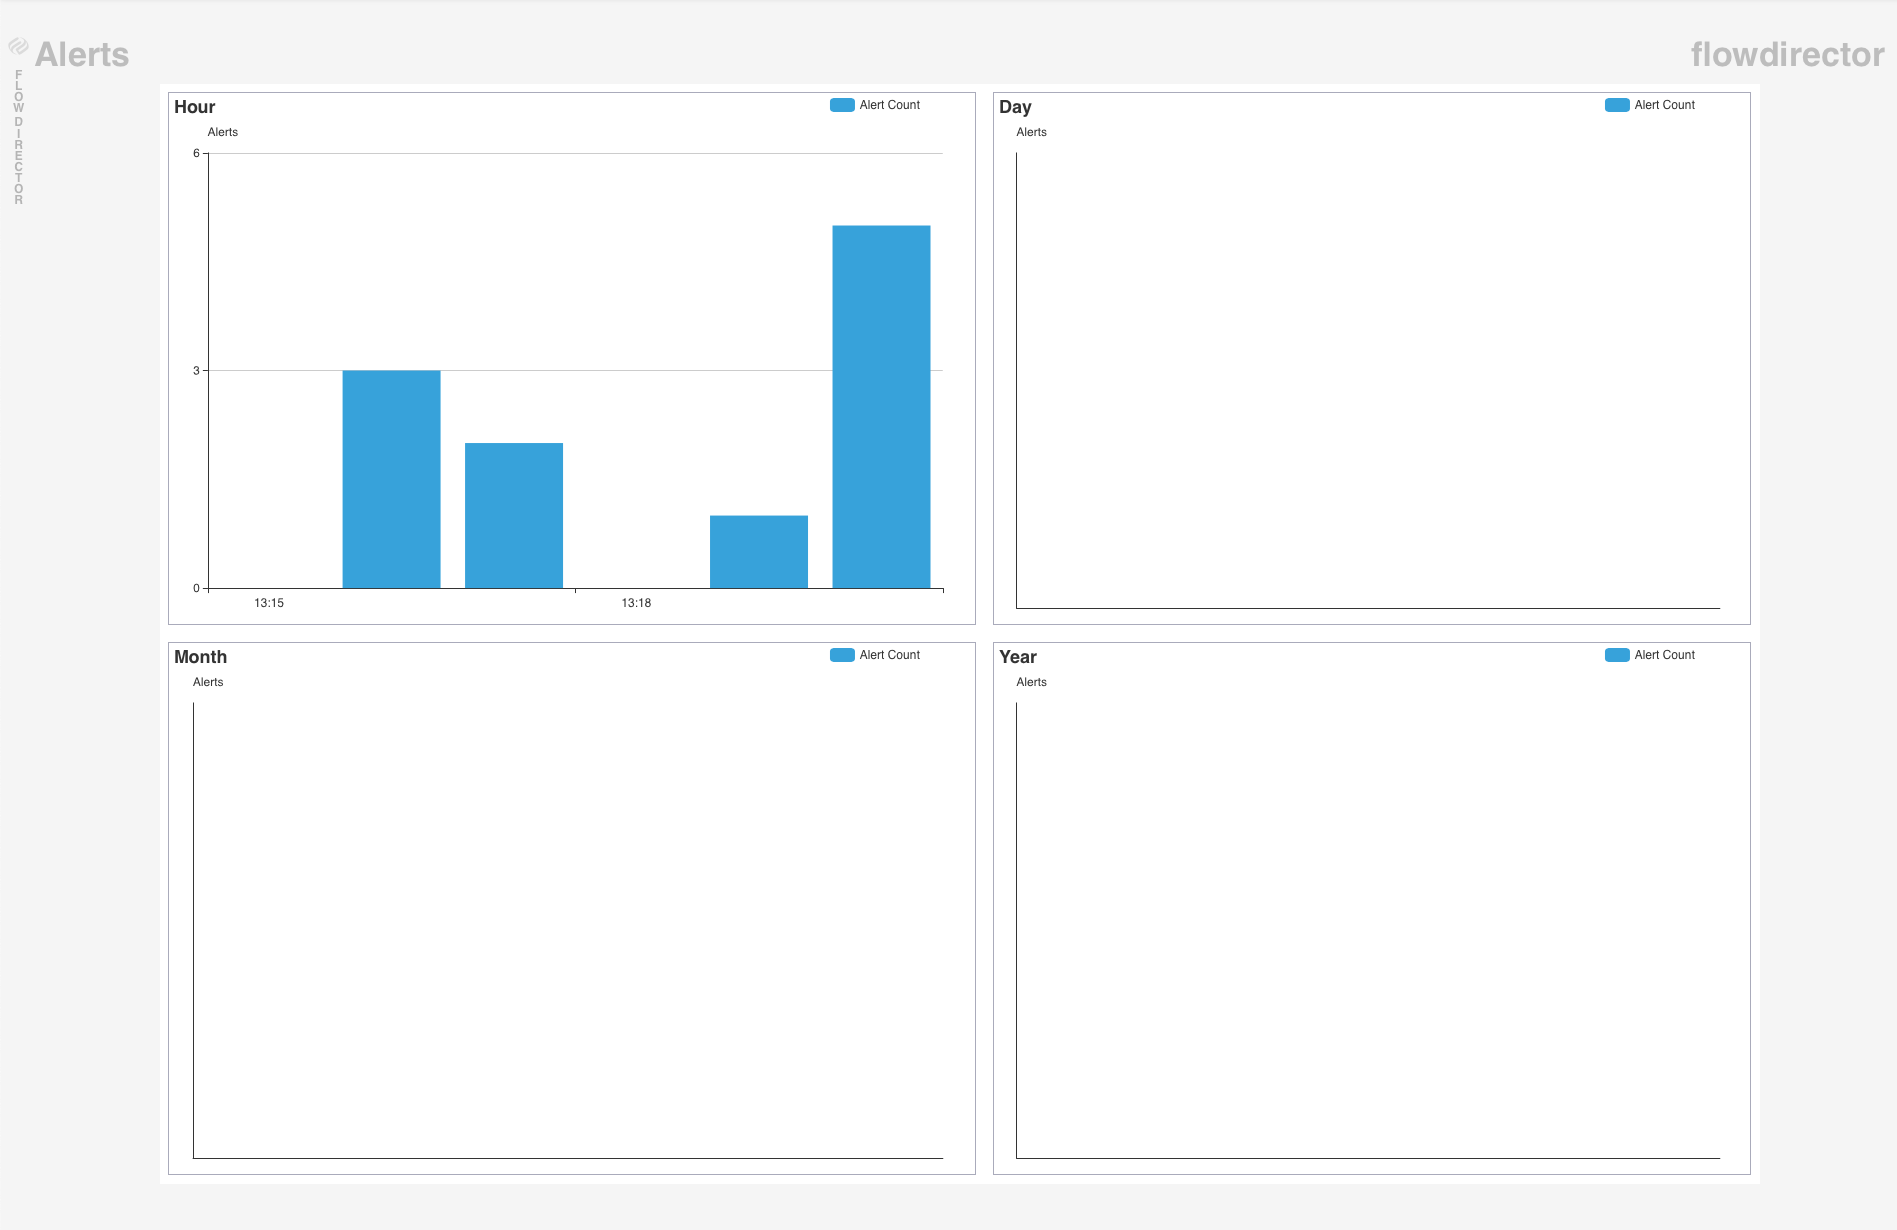
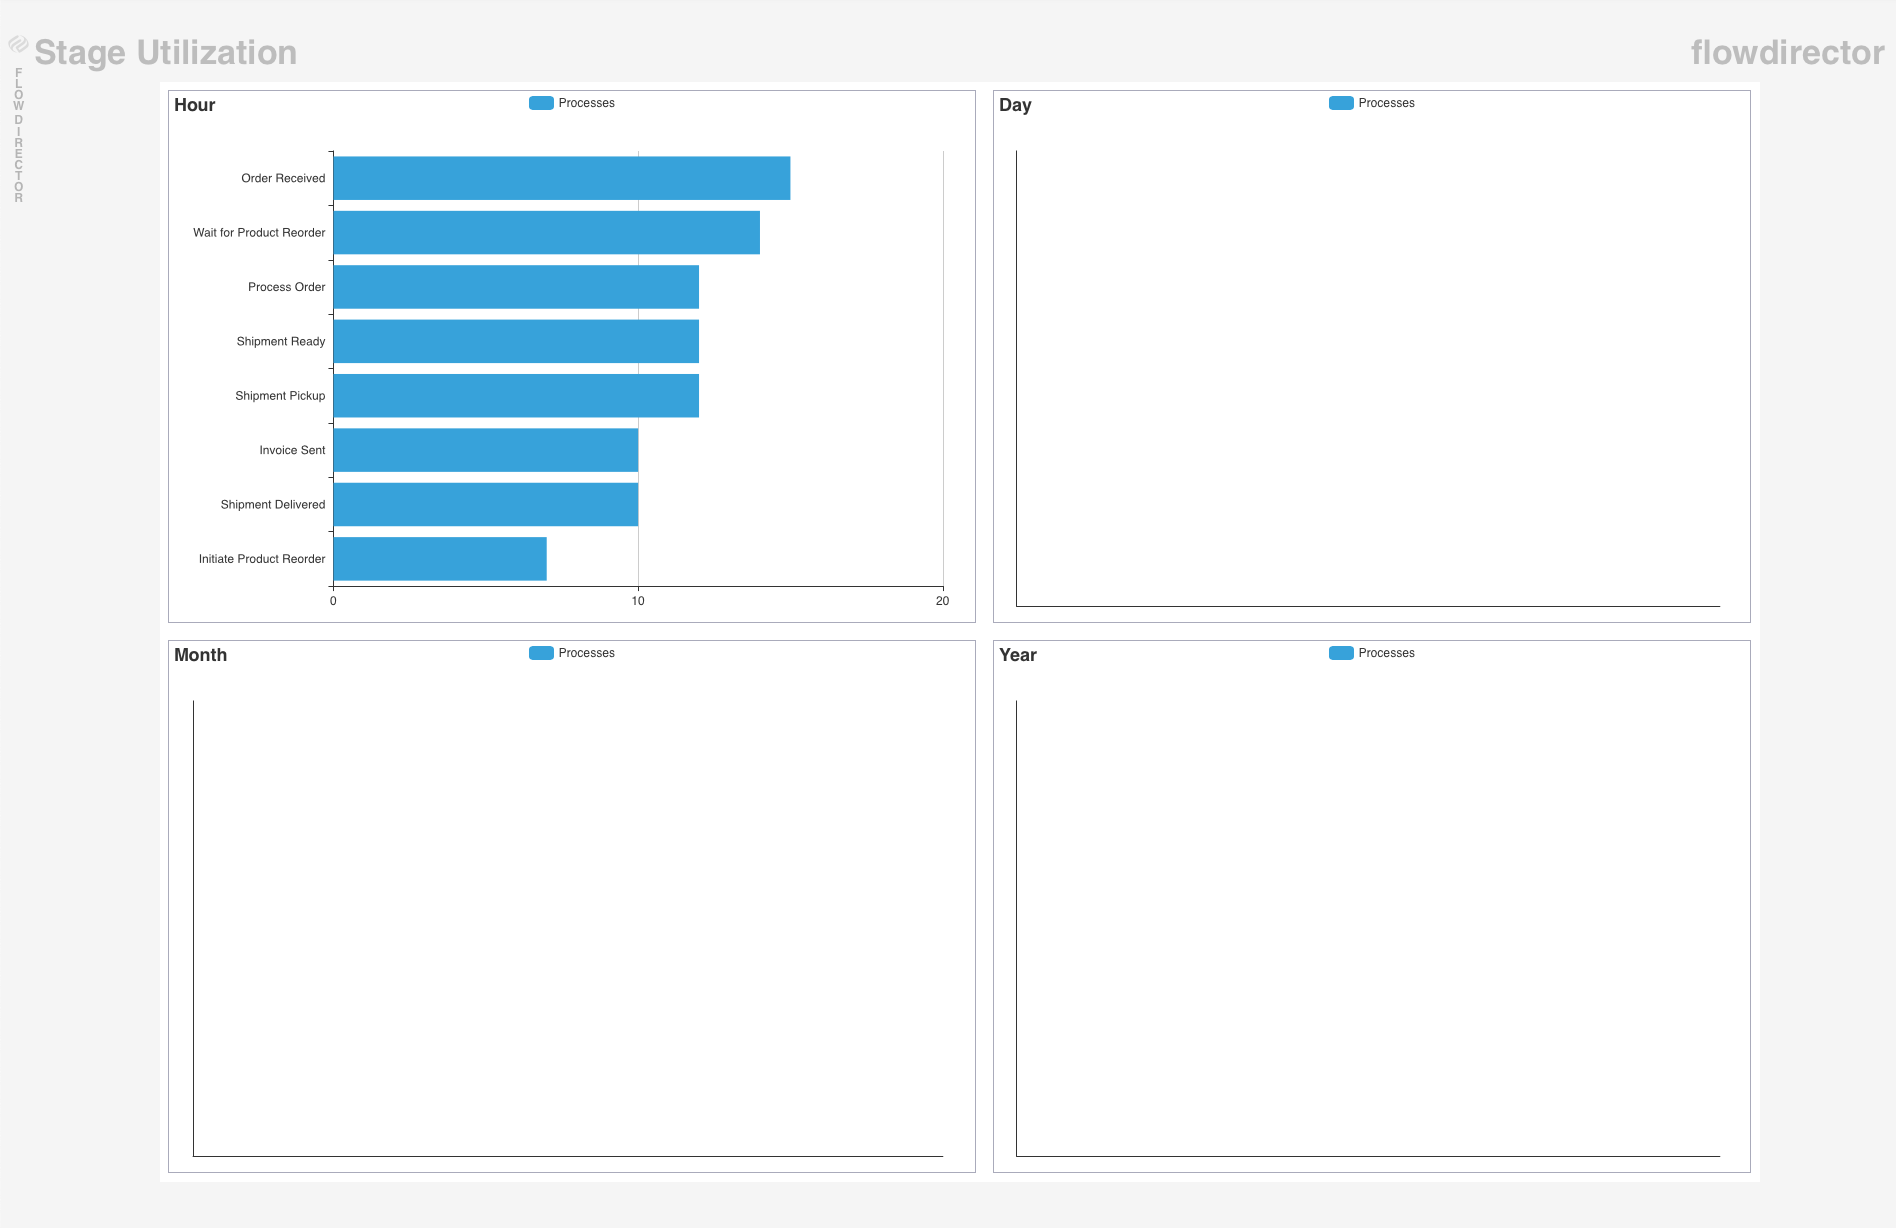
All history dashboards display 4 charts for the current hour, day, month, and year.
Alerts
This dashboard displays the history of alerts sent.
Stage Utilization
This dashboard displays the history of the utilization of the stages.
In Transit
This dashboard displays the throughput history (processes in transit).