Dashboards
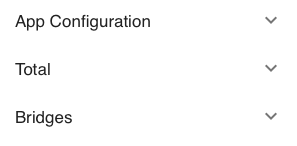
Several dashboards are available under the app’s menu:

Click on it opens it:
Total
Dashboards under the Total menu display the total throughput of all bridges currently and as history:
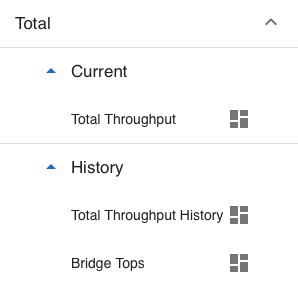
Current / Total Throughput
This is the default dashboard which is shown when you log into the app.
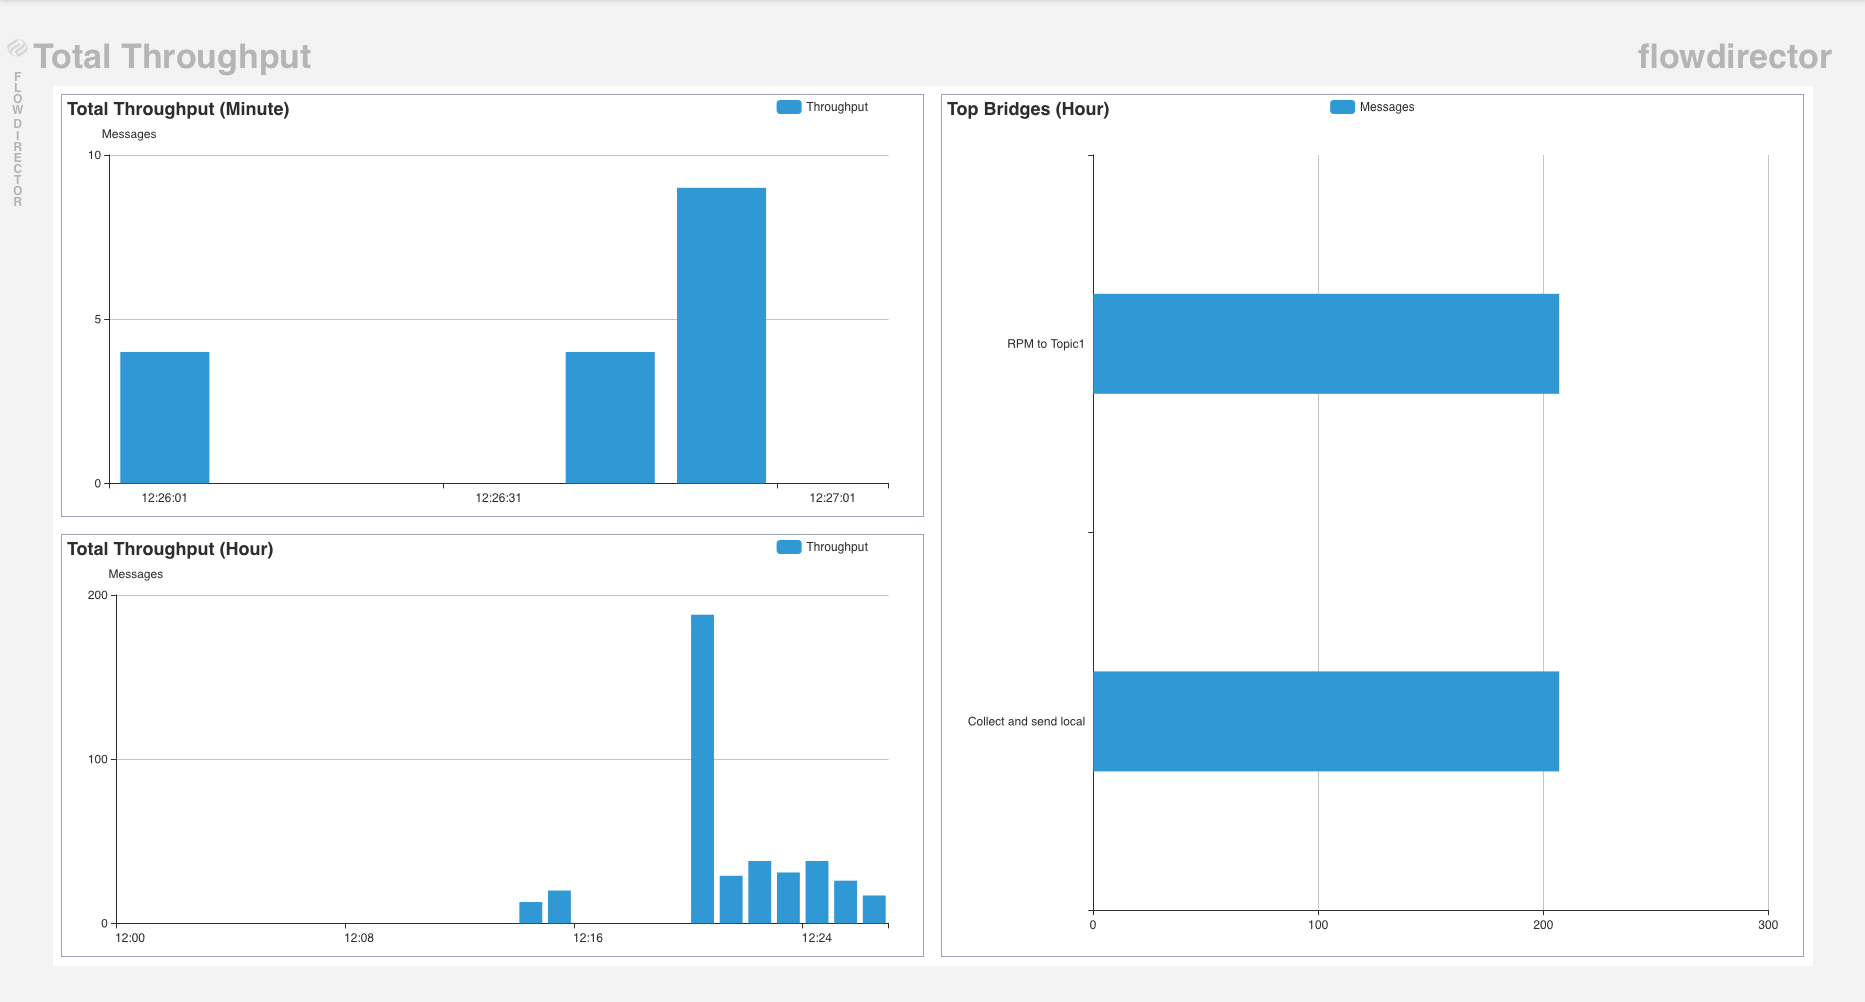
It shows the total throughput of all bridges cumulated in a minute and hour chart on the left, and a group chart on the right side.
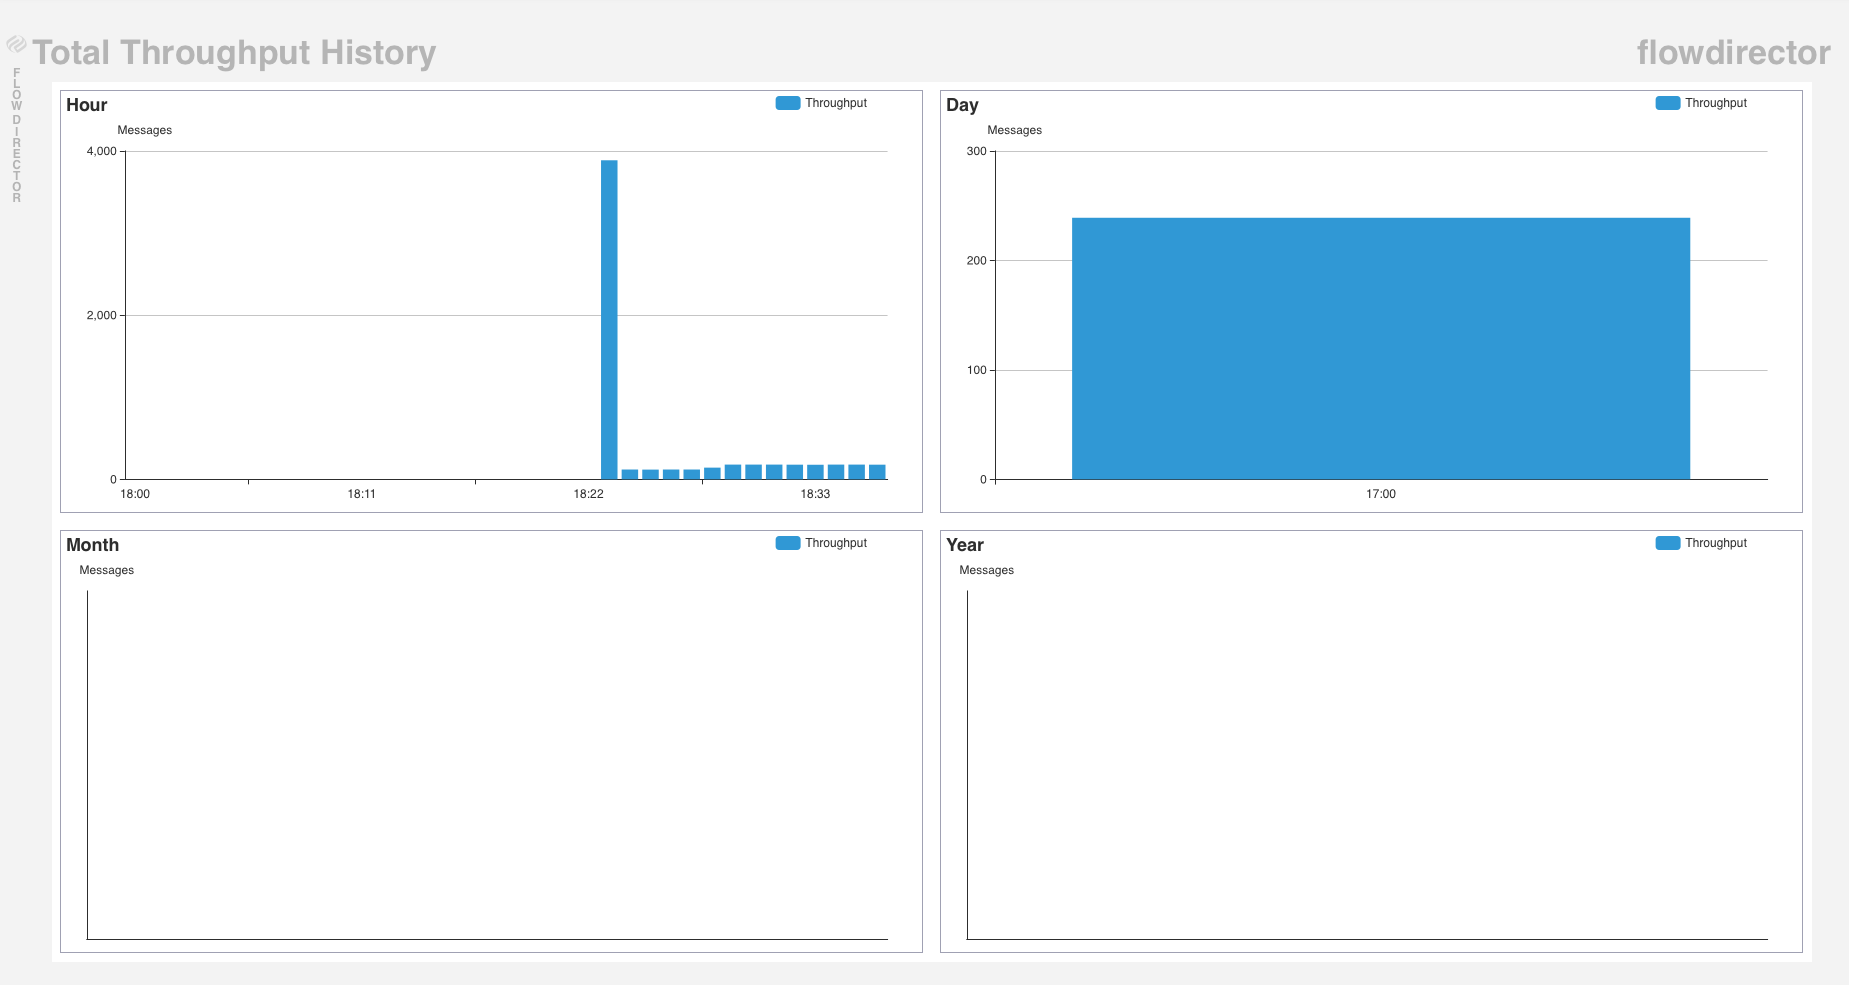
History / Total Throughput History
This dashboard shows a history of the total throughput of the current hour, day, month, and year:
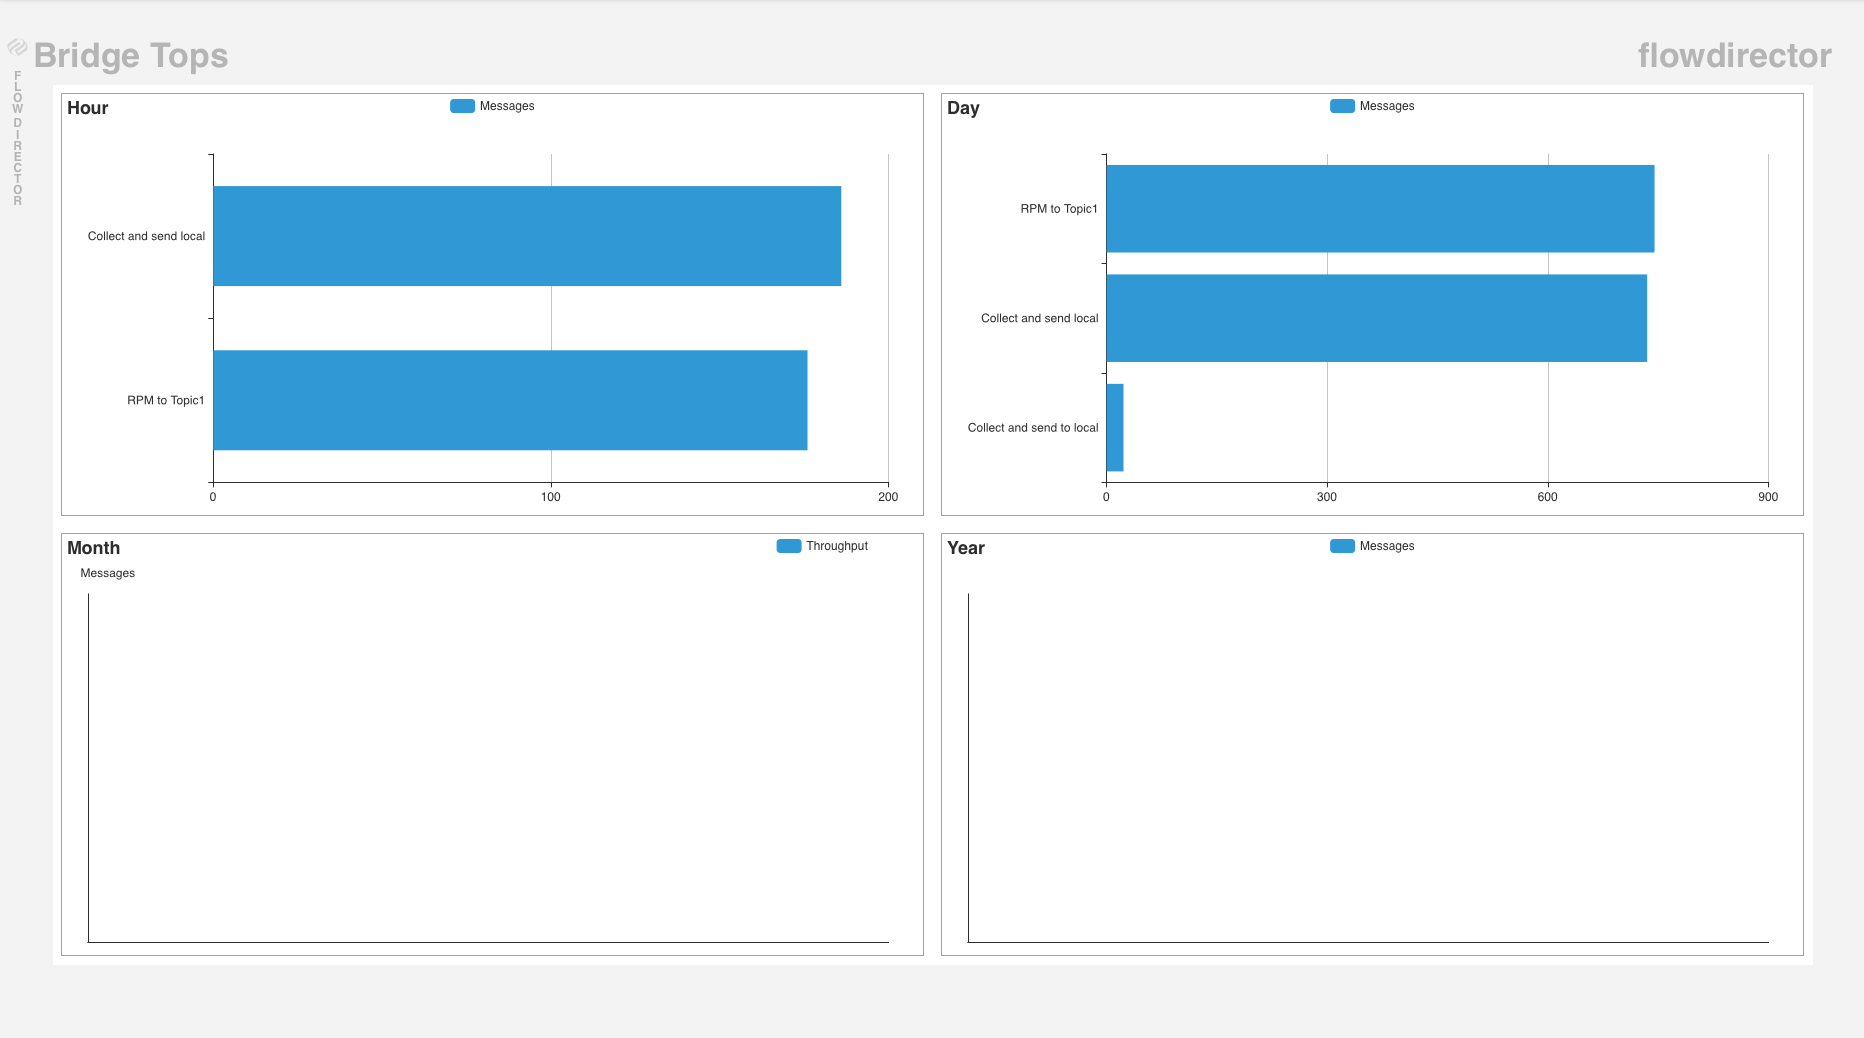
History / Bridge Tops
This dashboard shows a group chart history of the bridges ordered by the descending throughput of the current hour, day, month, and year:
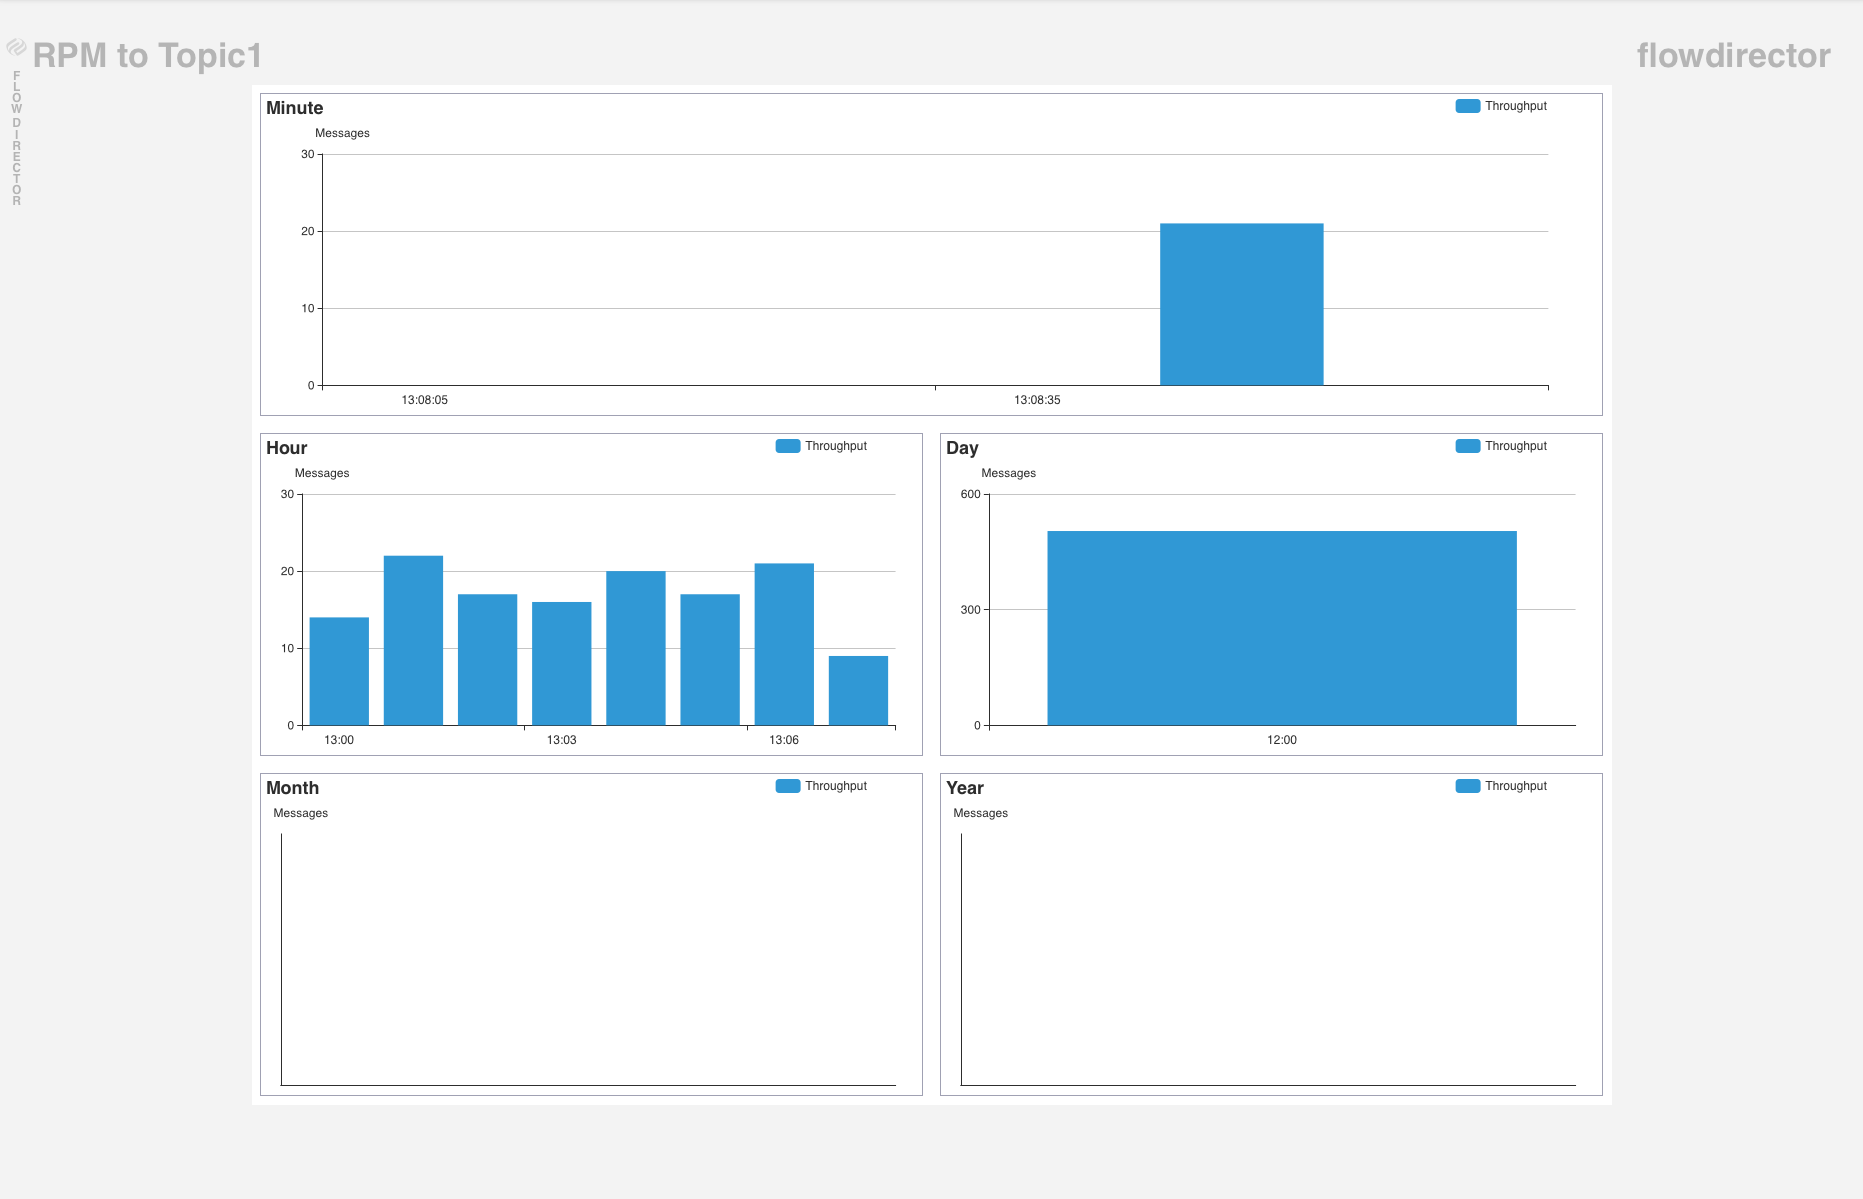
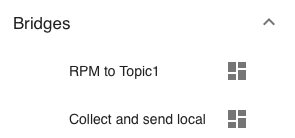
Bridges
A dedicated dashboard exists for every configured bridge:
It shows the throughput of that bridge of the current minute, hour, day, month, and year: