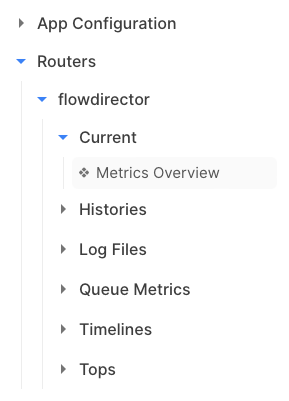
Click the menu item Routers. It will list each available router as a menu item. Each router has the same submenu items.
Current
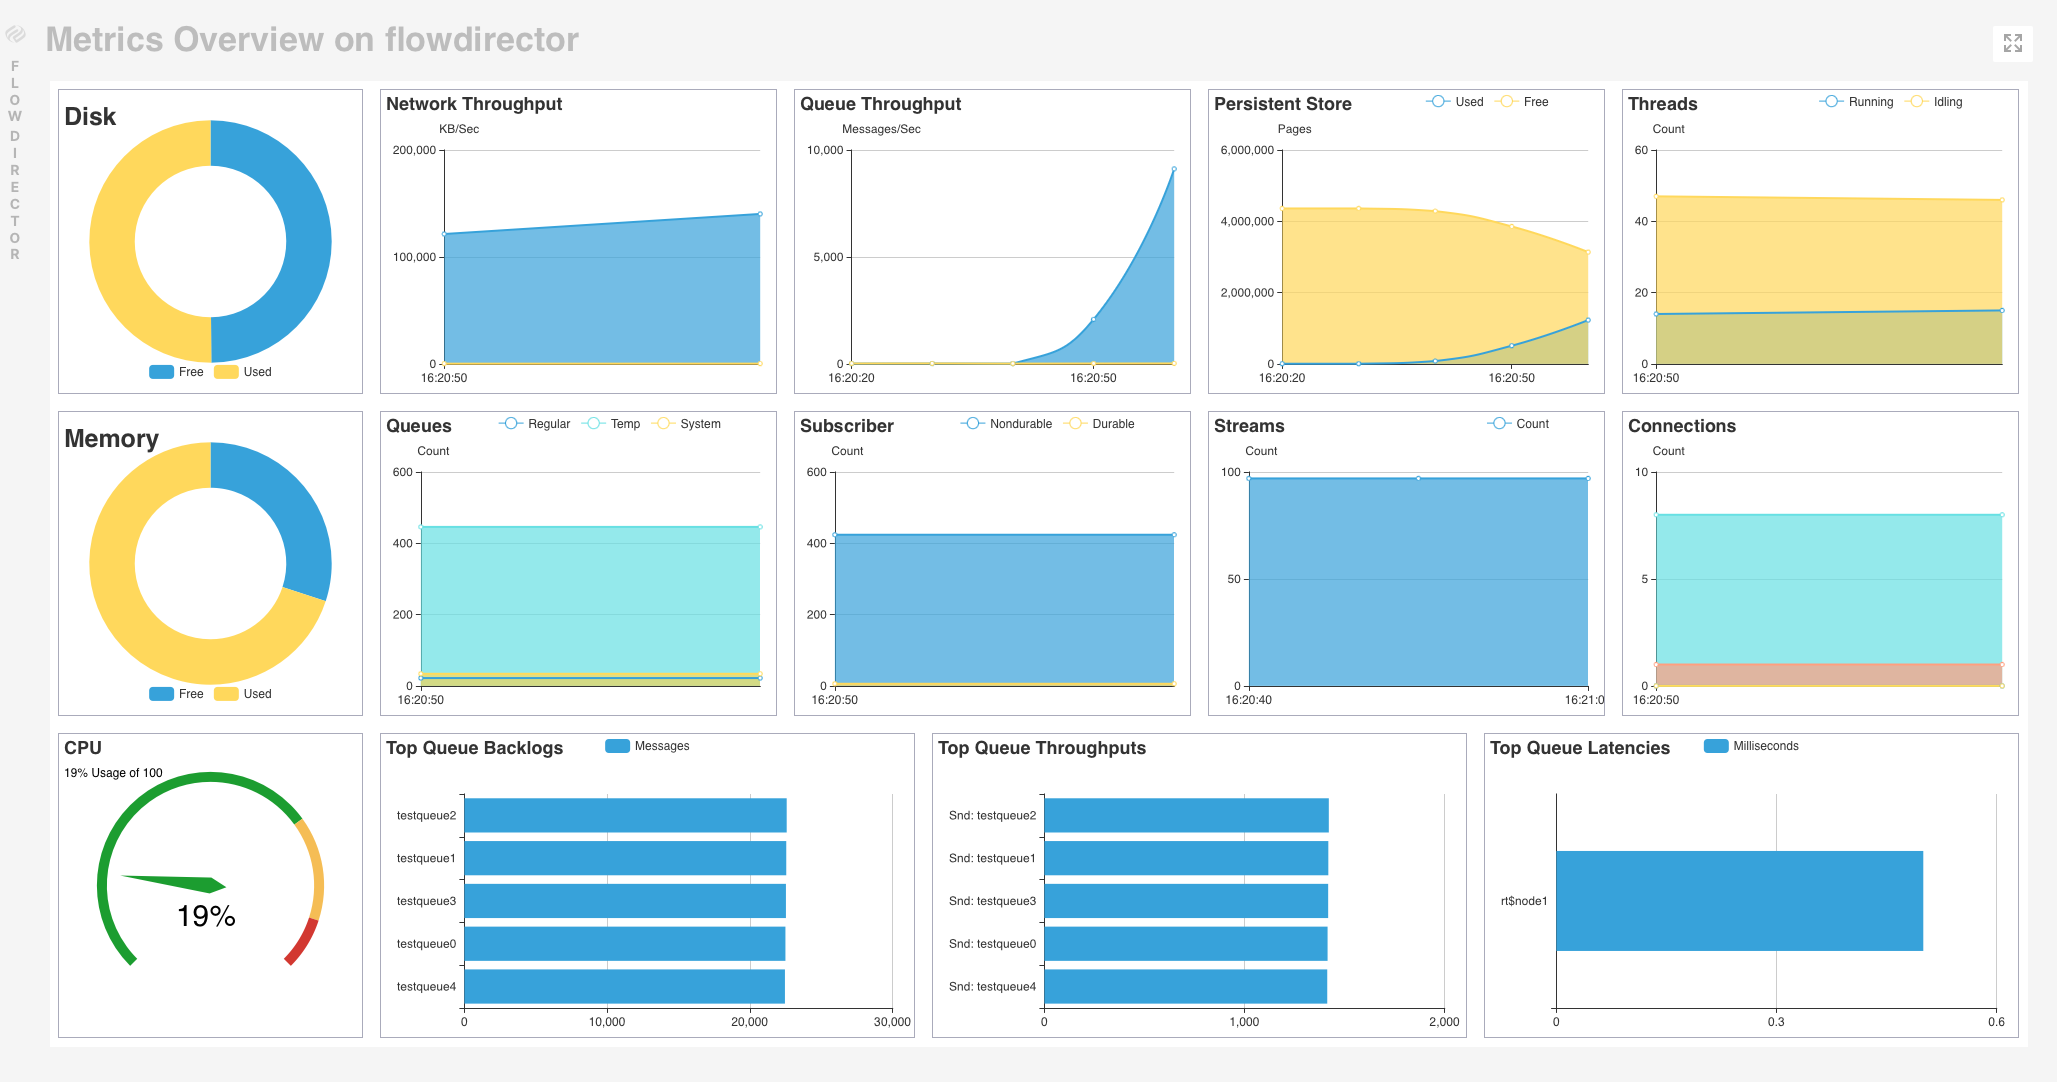
The menu item Current contains the dashboard Metrics Overview.
The dashboard shows the router's current status, including the network throughput, subscriber, memory, CPU, and many more.
Histories
Histories include the history of each router parameter, shown in the current state dashboard Metrics Overview.
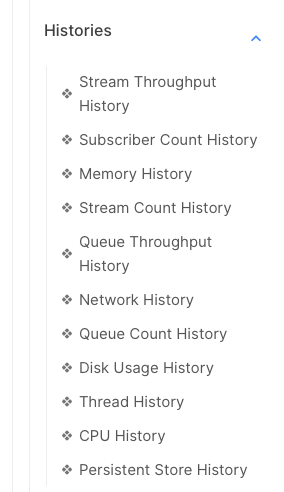
Each history dashboard displays the metrics over the last hour, last month, last day, and the last year.
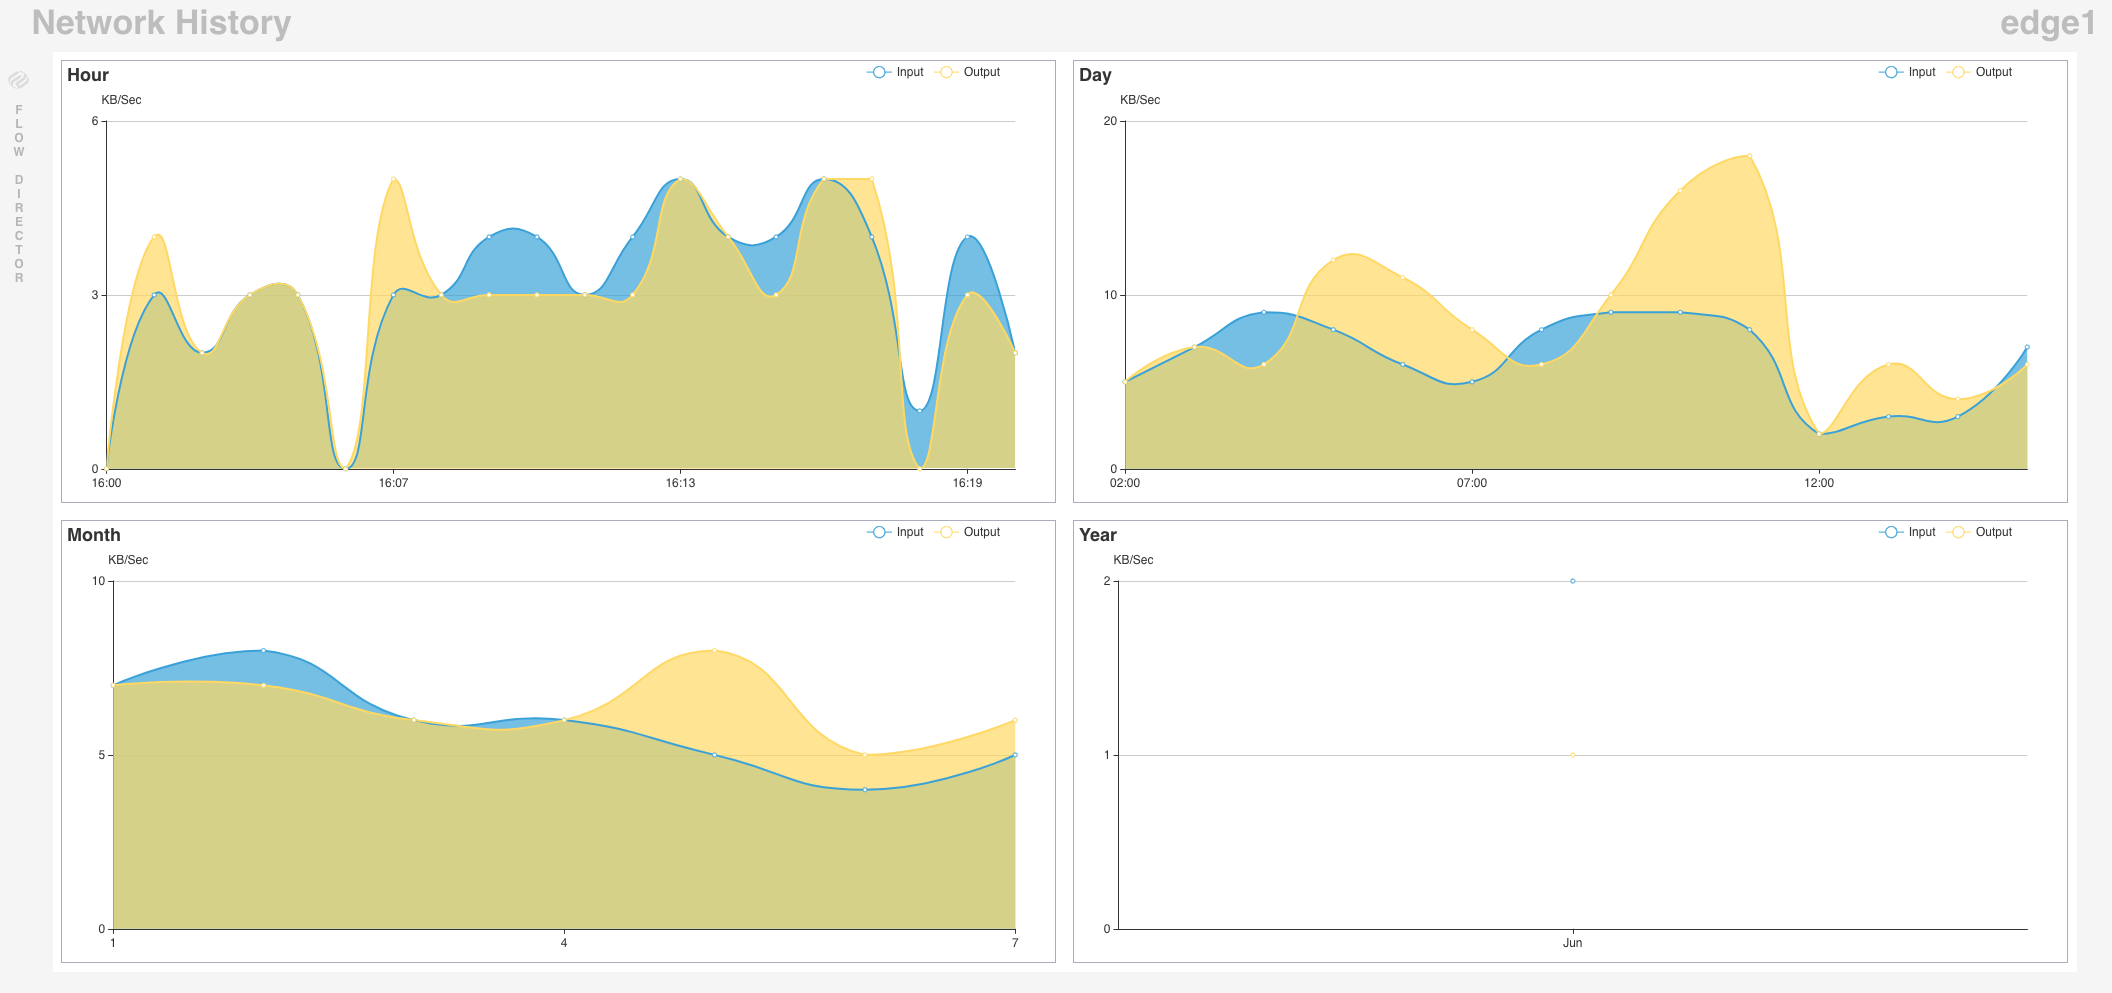
Tops
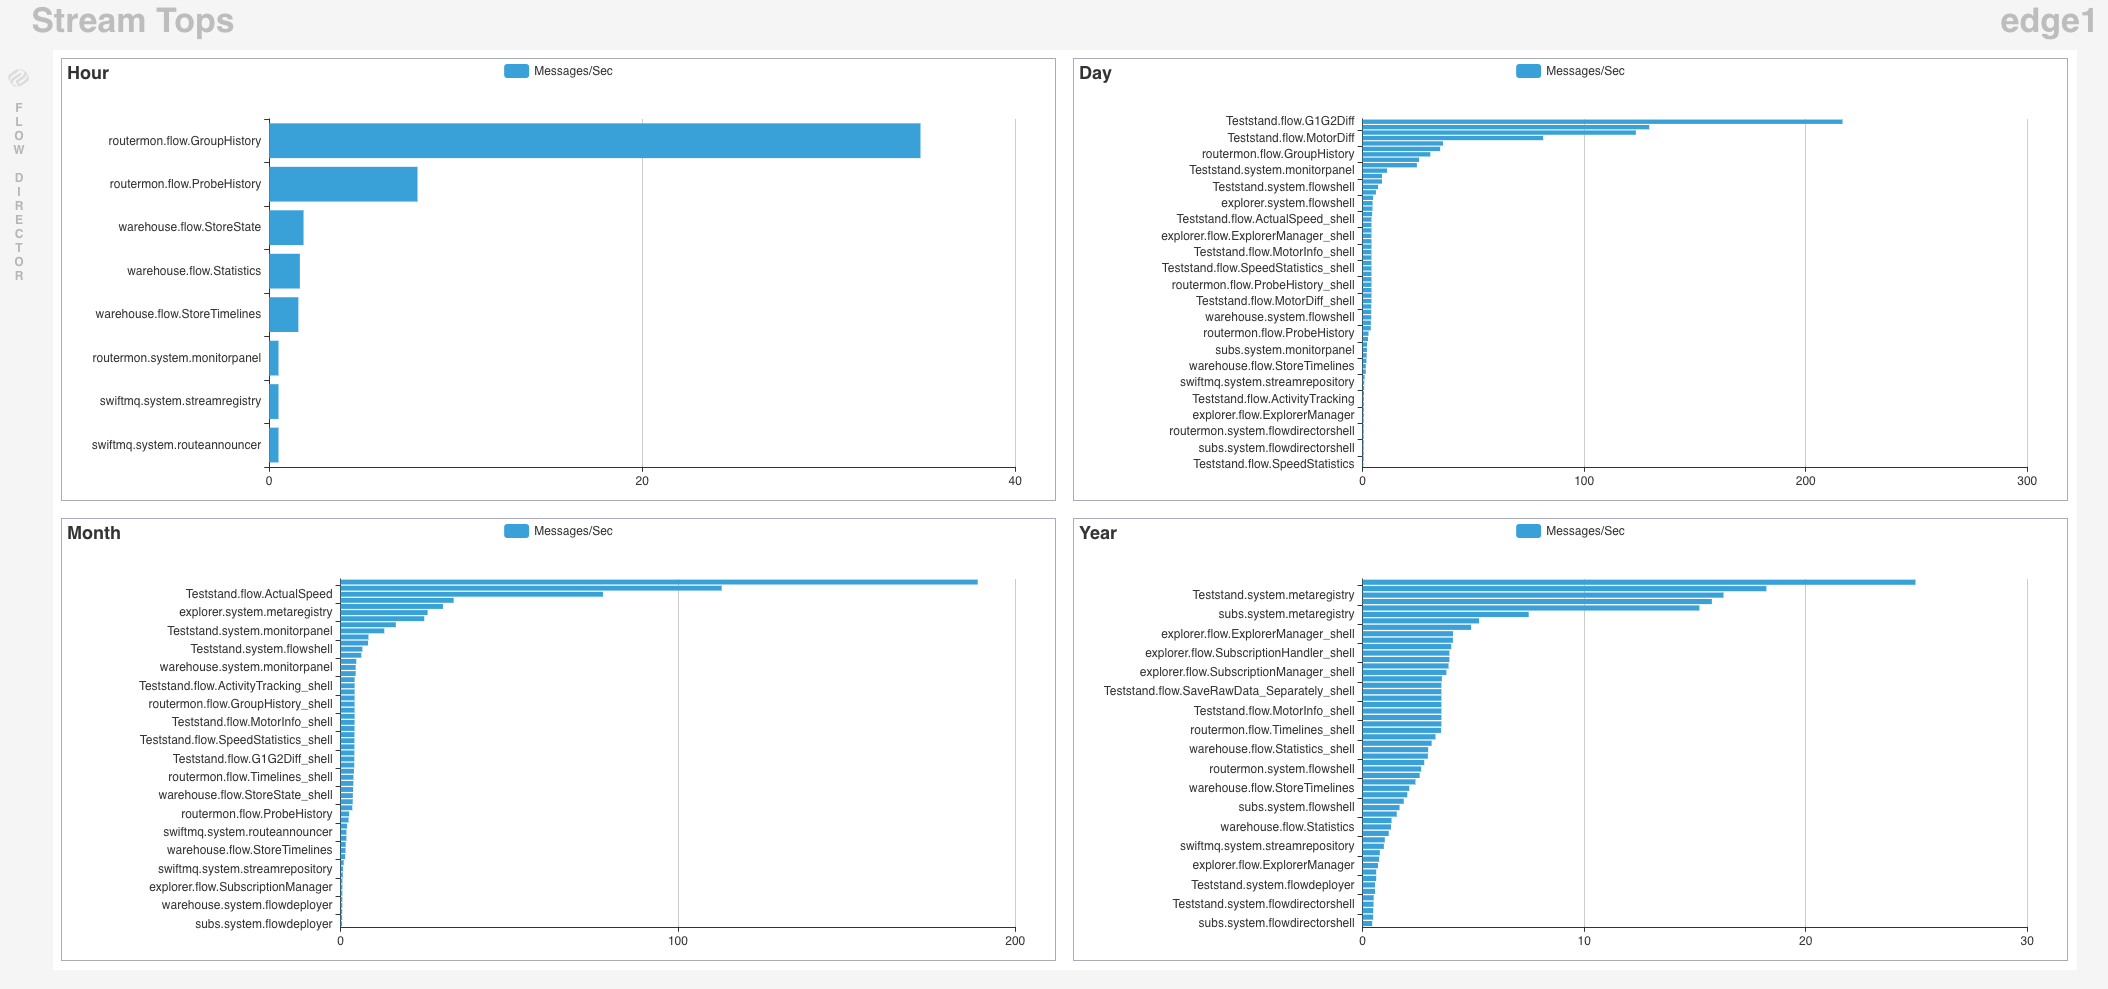
Tops contain the history of the throughput of the queue, streams, and thread pools. The history displays the throughput of the last hour, month, day, and year.
Log Files
Log Files contains a single entry of the combined router's info, warning, and error log file. If you run the JavaMail Bridge Swiftlet and have mail logging enabled, you'll see one entry for every mail log file:
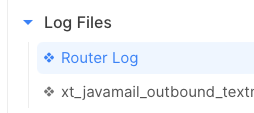
Click on an entry to view the log file in a table:
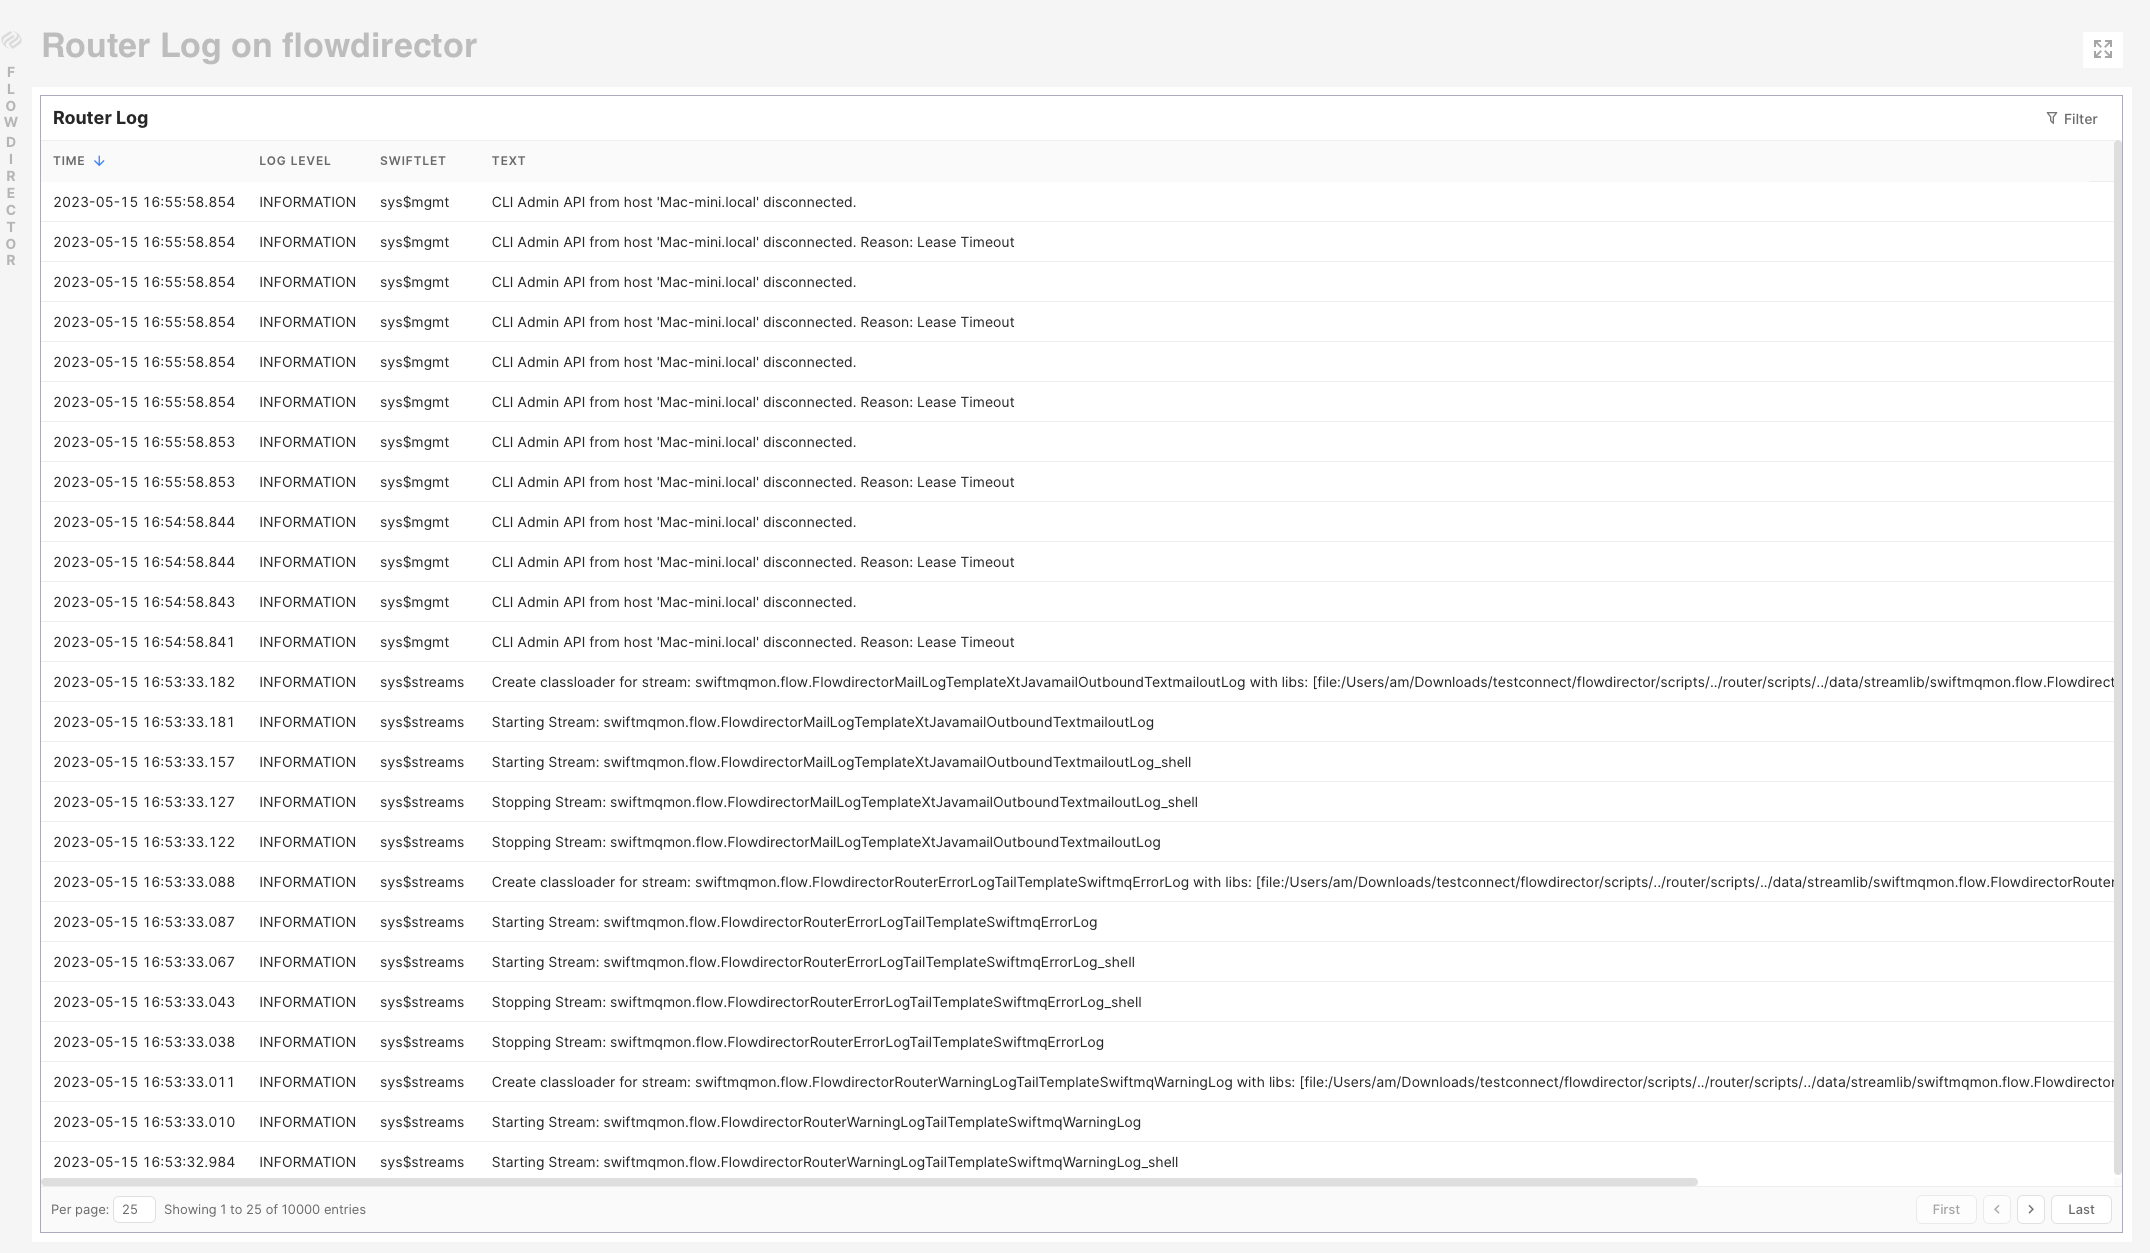
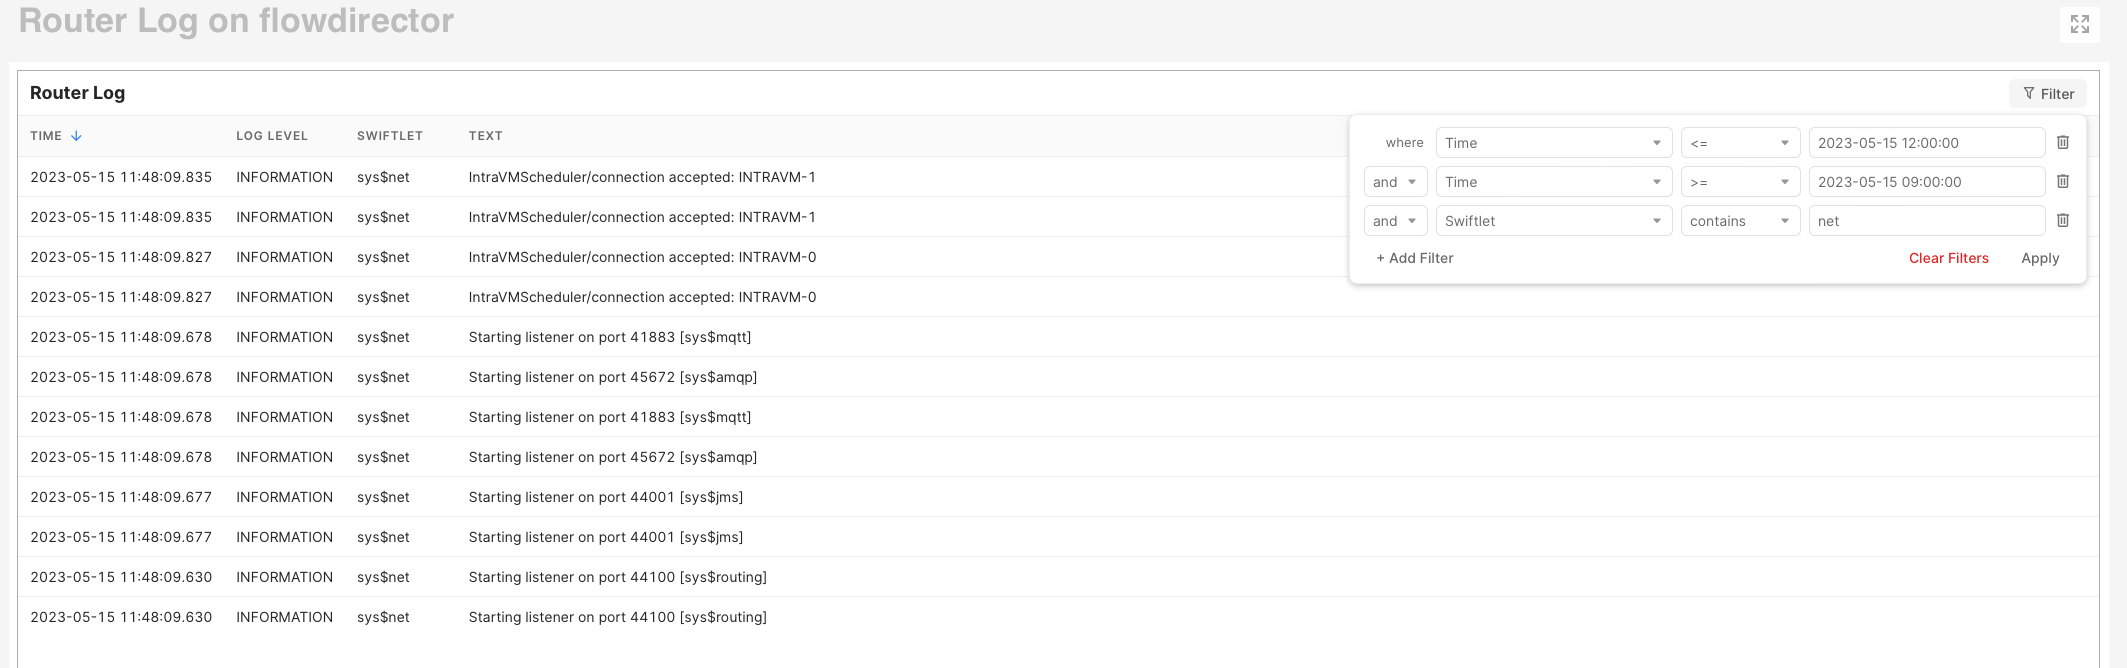
The table is in descending order by default by the TIME column, so you see the latest entries on top. The order can be changed by clicking on any column.
The bottom contains the current position and buttons to change the page. The displayed log file is limited to 10000 entries.
You can filter the log table by defining a filter. You can combine any field here. The time format is the format displayed in the TIME column.