Queue Metrics
Queue metrics are useful if you want to monitor a queue over a longer period.
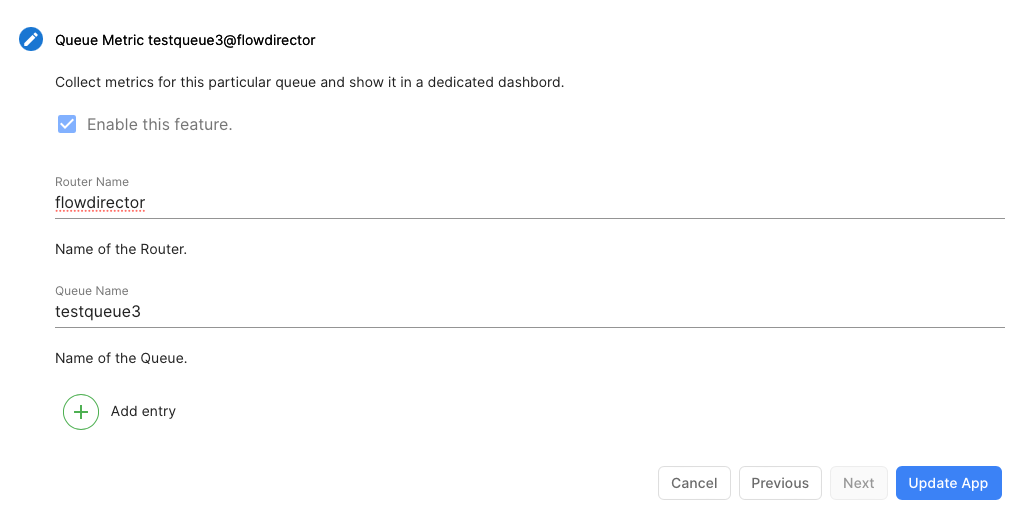
You can enable to collect and display metrics of any queue through the Setup Wizard which is activated from the toolbar:

For each queue you want to monitor, create one Queue Metric entry:

Then hit the UPDATE APP button.
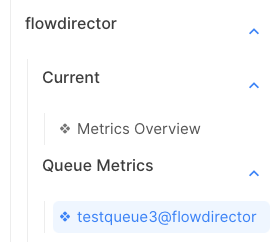
You’ll find a dedicated dashboard under the Queue Metrics folder of the respective router:

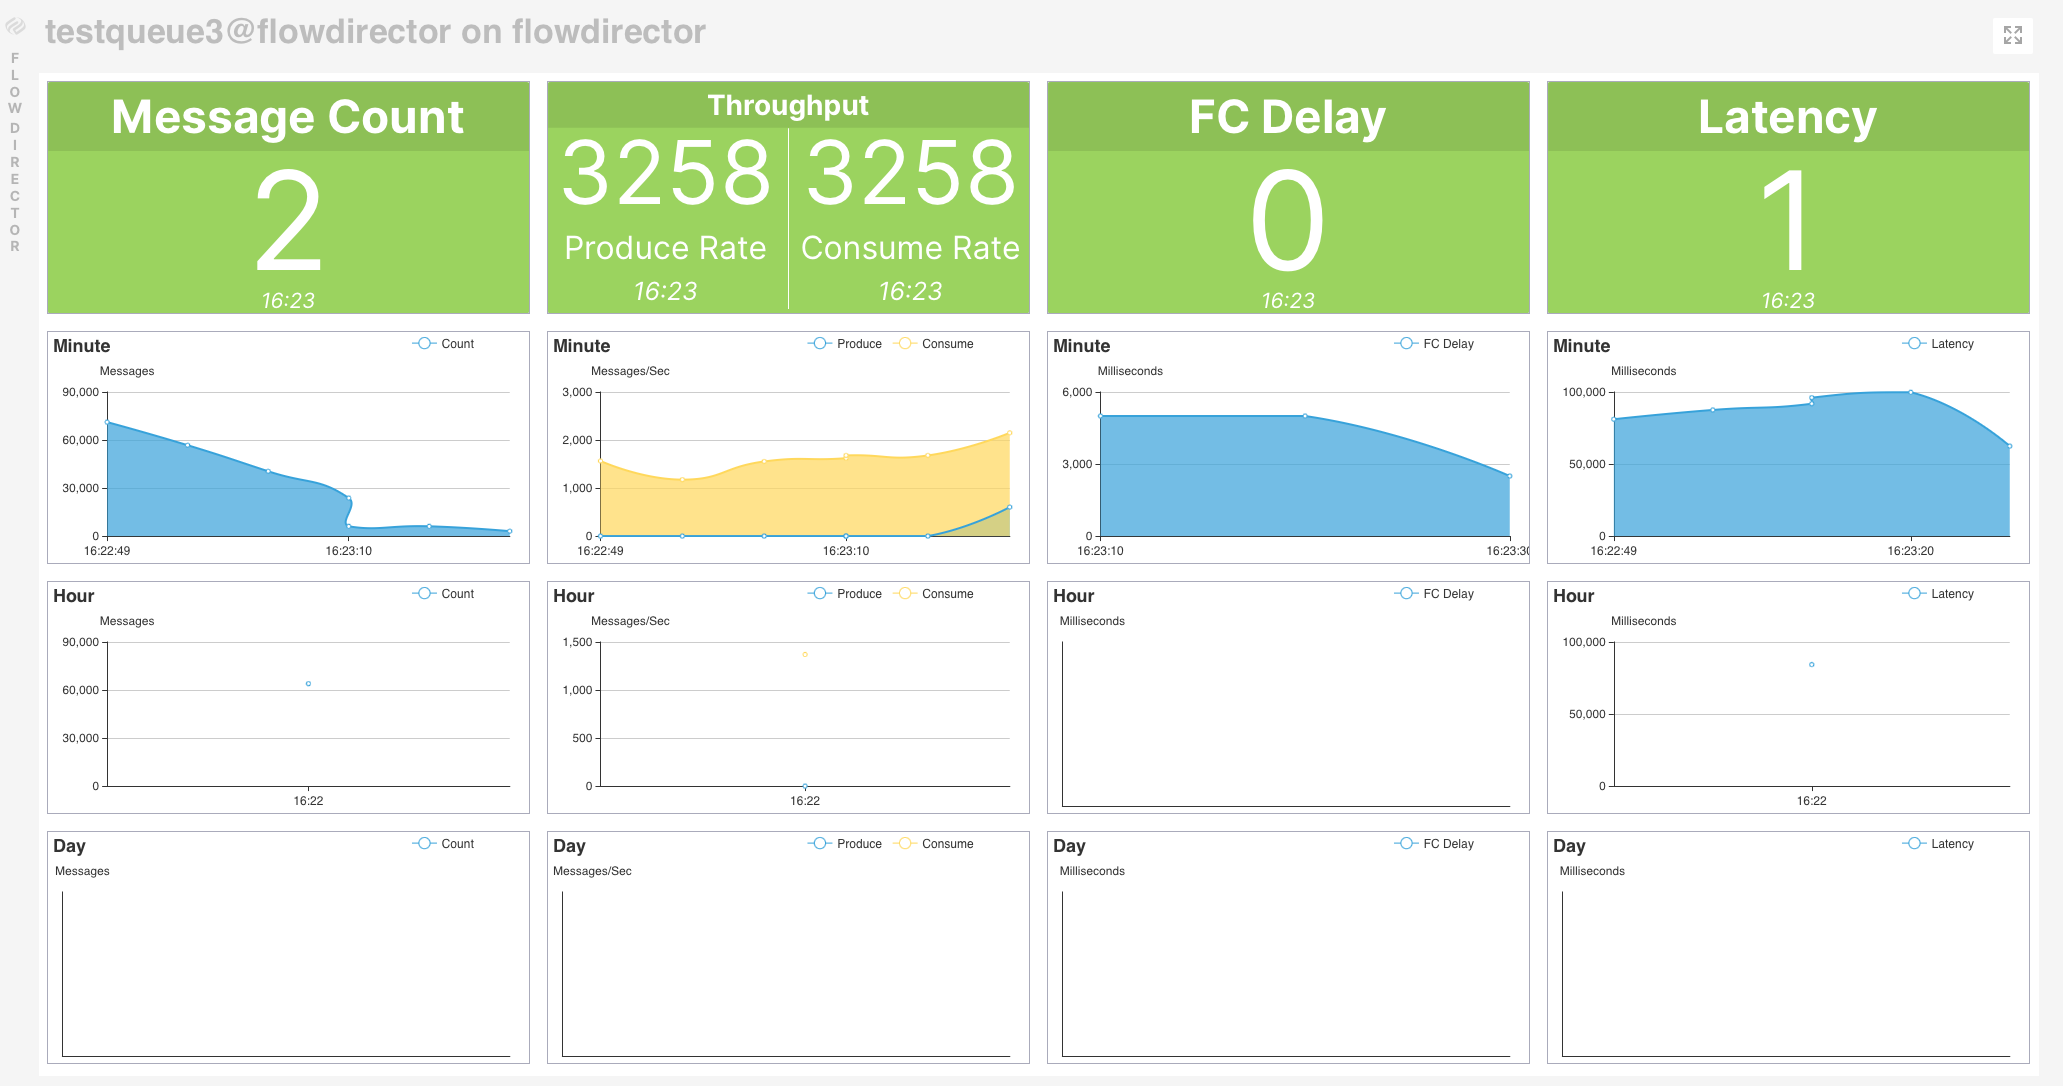
The dashboard shows the current message count, the throughput in messages per second, the flow control delay, and the latency. It also shows histories of all metrics in a minute, hour, day, and month chart:

Monitoring Routing Queues
A routing queue, prefixed with rt$, works as a buffer for outbound messages to another router. Messages are sent to the routing queue from producers. However, the consumer of the routing queue is the routing service that actually transfers the messages over the wire. You can therefore only get the production rate to the other router.
For example, we have two routers connected, flowdirector and node1, and you want to see the outbound and inbound rate of router flowdirector. To get this, you need to create two Queue Metrics:

One to get the outbound traffic from flowdirector to node1 and one to get the outbound traffic from node1 to flowdirector (which is the inbound traffic for flowdirector).
flowdirector to node1:

node1 to flowdirector:

In this example, flowdirector has 0 messages/sec outbound and 3 messages/sec inbound.
Mostly, the production and consumption rate on a routing queue is the same. A higher production rate means the routing service is not able to send at the same rate, so a message backlog will accumulate in the routing queue.
