Dashboard Editor
How do I add items to my new dashboard?
Simply click-and-drag to select the cells until they reflect the desired size of the item you want to create.
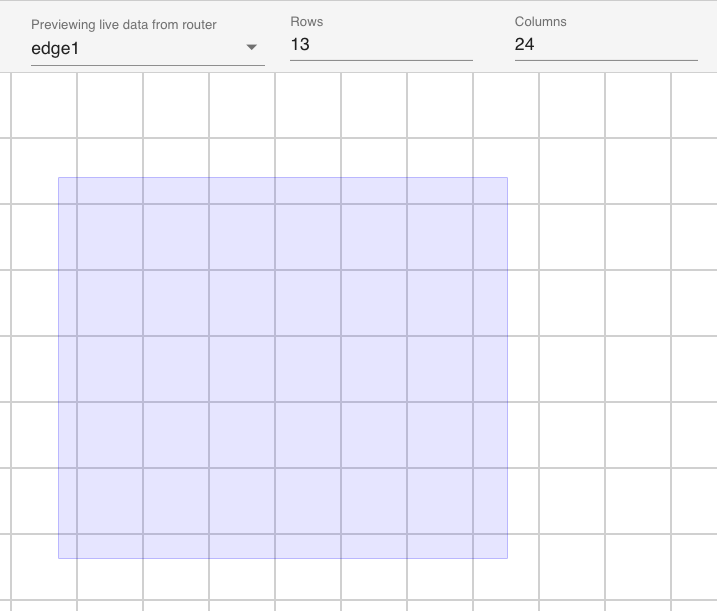
Note that items cannot overlap other items and cannot extend beyond the dashboard canvas.
After inserting a blank item, click the edit icon to bring up the Component Selector for the item you just created.
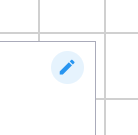
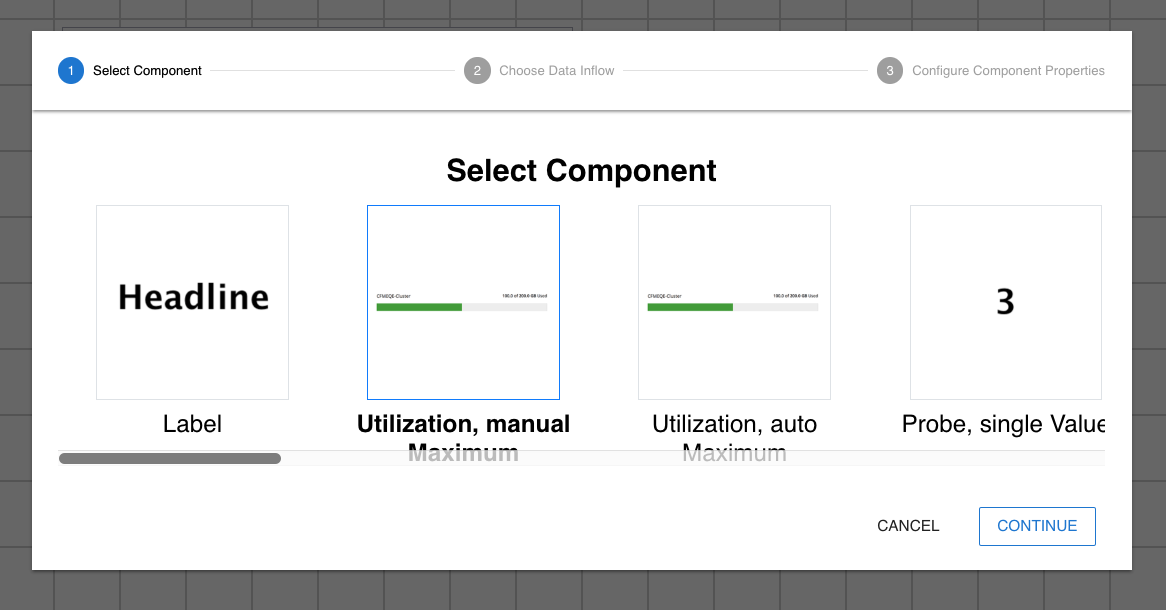
The selector is where you define the following:
- Component Type - There are many choices, such as chart, label, terminal shell.
- Data Inflow - Where does the item get its data from?
- Component Properties - Configuration required for the type chosen. Such as label names or background colors.
What does a Dynamic router mean when selecting a Data Inflow?
A dynamic router means that the dashboard item will retrieve it's data from the router/node, for which it is grouped under within the menu. This might seem complicated at first, but once you see it in action, it is actually very straight-forward.
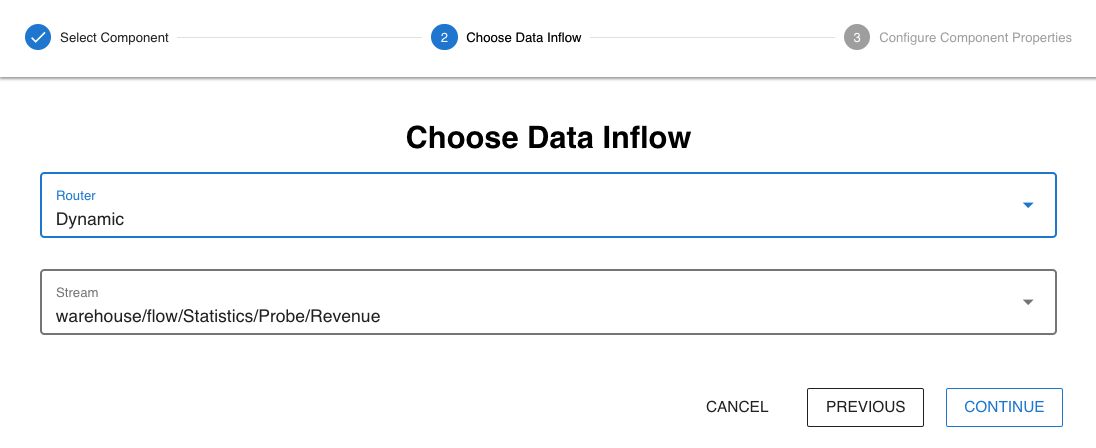
You need to keep in mind that the Router Network menu item in your menu is a dynamic group that creates child items for each available router. This means that if you placed a dashboard within the router group, and there are 5 routers, there will be 5 links to the same dashboard, one under each router. When you click the dashboard under a specific router, which we'll refer to as the target router, the target router will be substituted for items that have a dynamic router data inflow. In other words, dynamic means, fetch me the data from whichever router I'm currently interested in.
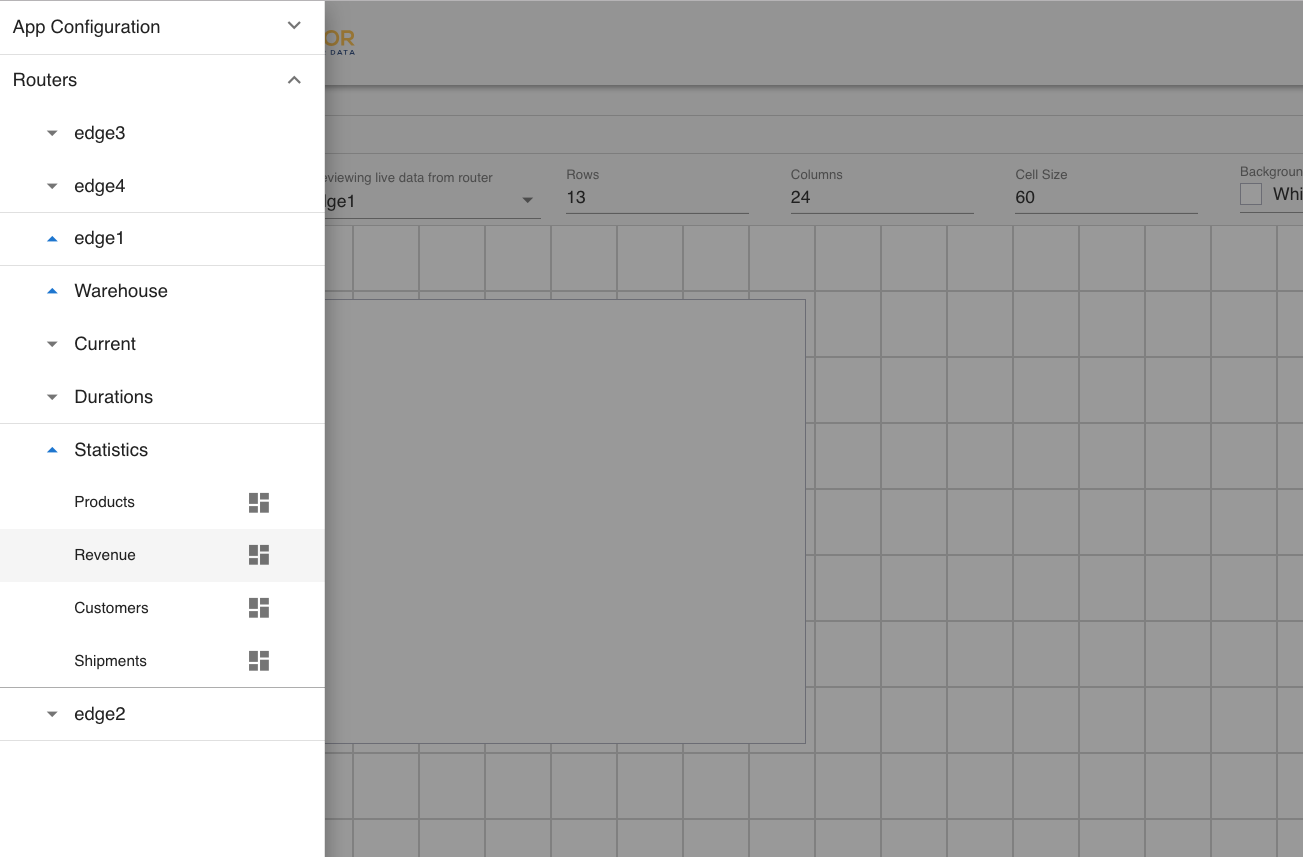
Accessing the Revenue dashboard like this will present the data from edge1
You are also able to set a static router. As you expect, if you select a specific router, the dashboard item will always retrieve data from the selected router, regardless of how the dashboard was accessed from the menu.
Why does my dashboard editor keep changing size?
The default is for the canvas to take up the available width and height of your browser window. If you would like to specify the exact dimensions of your dashboard, you can do so using the Rows and Columns input from within the toolbar. Once you set the number of rows or columns explicitly, your dashboard will stop resizing automatically, and this behavior cannot be reversed.

Whether your dashboard is auto-sizing or fixed, when the dashboard is actually displayed 2 things will happen:
- Unused spaces will be automatically removed. Unused spaces refers to[ any cells further than the most right item and any cells below the lowest item on your dashboard.
- The dashboard size will automatically resize to fill the browser window, while still keeping component aspect ratios.
