Process Analyzer
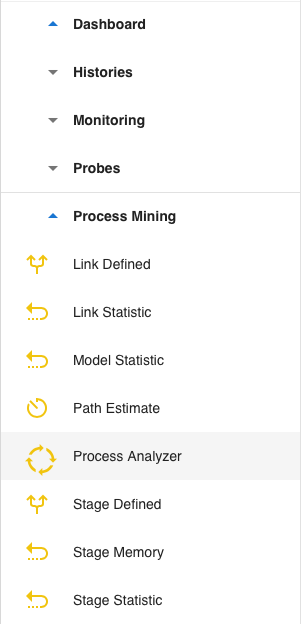
The flow component is located here:
Requirements
Unique Key
To analyze a business process, you need a unique key that identifies a process. This unique key is called theProcess Property and must be contained as property in every message fed into the Process Analyzer.
Process Stage
A process is an entity with a unique key (Process Property) that travels through several Process Stages. A Process Stage is a business activity identified by a name contained as a property in every message. For example, stages in an order process can be Order Received, Order Processed, and so on.
The Process Analyzer automatically tracks the unique key paths when it travels through the stages and builds a process model dynamically.
KPI Values (optional)
KPI means Key Performance Indicator. A KPI value is the value used to form a KPI. It can be any property value of the input message. In an ordering scenario, this could be the order amount. KPI values are optional, but if specified, they must be contained in every input message to the Process Analyzer.
Process Analyzer Connectors
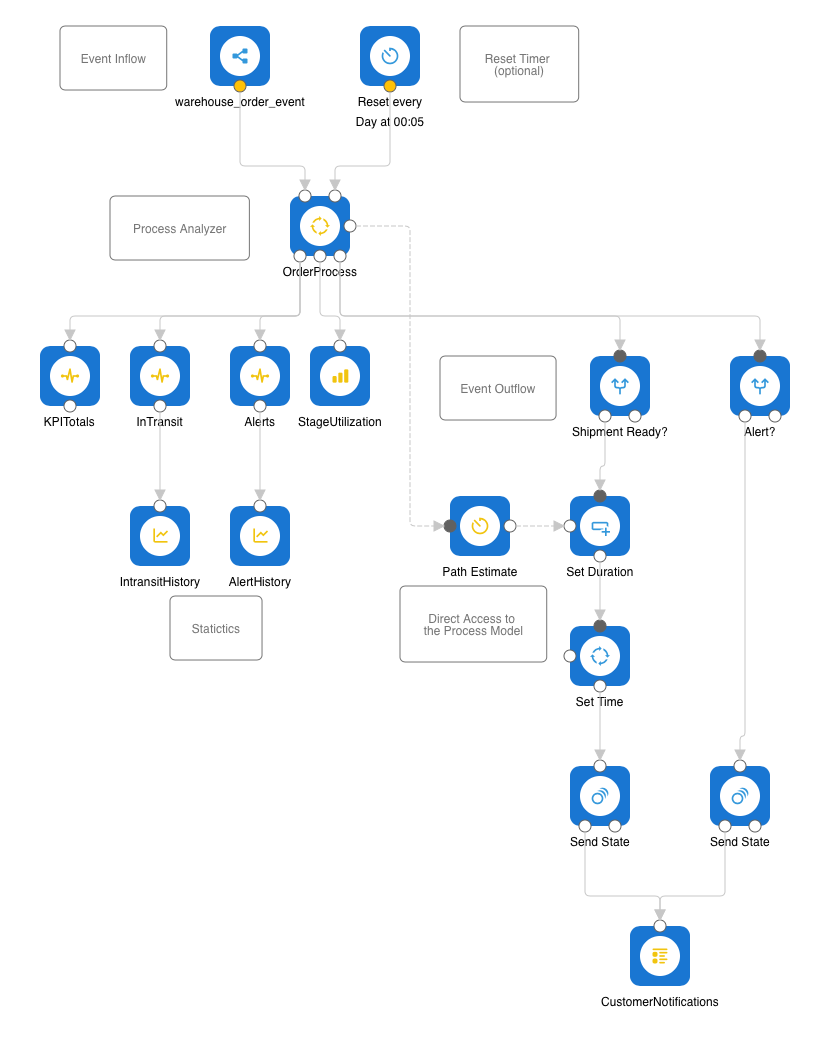
The Process Analyzer has multiple input and output connectors, as shown here:
Event Inflow Input
These are the event messages that flow into the Process Analyzer. You can connect many inputs here, either from the local router or from other messaging systems like Kafka. You can also feed events from outside via REST and listen to the REST input topic. Or poll a database timer-driven on state changes and feed it into this connector. The sky is the limit here.
In the above example, we use the Warehouse sample that already sends correctly defined event messages with a unique key, a stage, and a single KPI value set and sends it to the topic warehouse_order_event. So we only need to listen there and feed it into the Process Analyzer.
Reset Timer (optional) Input
In case you want to start a new process model at a specific time, you can attach a timer and connect it to the Reset connector. In the above example, we reset the model every day shortly after midnight. All current data is deleted during reset, so you start fresh at that time. However, Process Analyzer takes snapshots of the model every 15 minutes up to 10 days in the past to view this data in the history.
Totals Output
Process Analyzer generates total statistics after every input event. Generated is a statistic message with the following properties set:
totalprocessed- Total number of processed events since the last resetintransit- Number of processes that have started but not yet ended (in transit)<kpi-property>_totalprocessed- Sum of the total processed KPI value property<kpi-property>_intransit- Sum or the KPI value property in transitalertcount- Current alert count
In the example, we use a Property Probe and History flow components to make these data available for dashboard components.
Stage Utilization Output
This statistic is also generated after every input event and contains the total processed events per stage. Generated is a statistic message with the following properties set:
stage- Name of the stagecurrent- Current total value of events passed through this stage
You can directly feed these messages into a Group History flow component to make the data available for dashboard components.
Configuration
The configuration of the Process Analyzer takes place when you click on it.
Process Name, Process Property, Stage Property
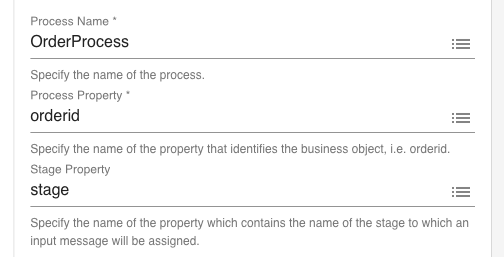
Specify a unique process name. Then specify the name of the property that contains the unique key. This identified your business object. Also, specify the property where you store the name of the stage.
Process Start and End Stages
If you start the flow that contains the Process Analyzer you might get events for processes somewhere in the middle of their processing. If you want complete processes only, you can optionally specify process start stages. If a process checks in with one of these stages, it is automatically linked to a Process Start stage. Incomplete processes are ignored.
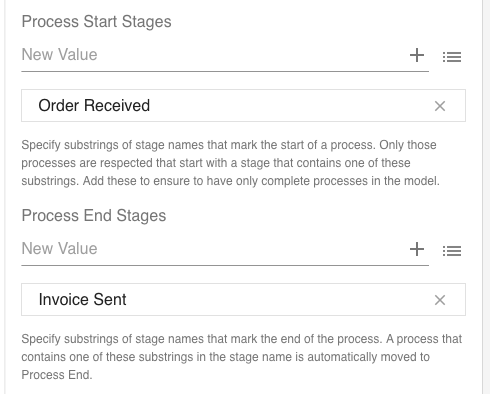
You can also specify process end stages. If a process checks in with one of these stages, it is automatically linked to a Process End stage.
Note that both lists contain substrings, matching stage names if it contains one of those substrings.
Happy Path
A Happy Path describes the optimal path of a process. This path is automatically built from the Process Analyzer by calculating sum totals / number path stages. If that is not sufficient because the optimal path is another one, you can define the Happy Path here:

Define the stage names that make the Happy Path but without Process Start and Process End.
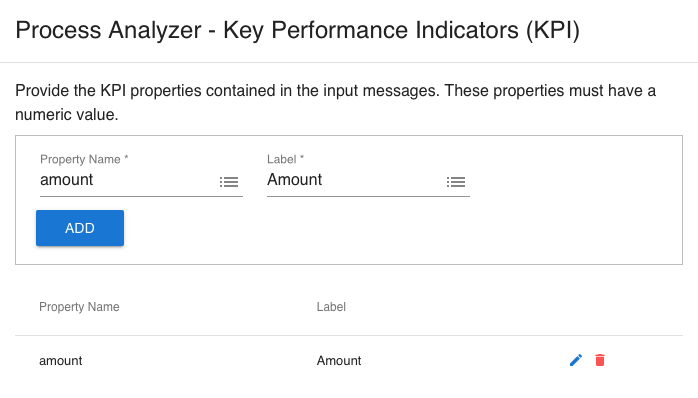
KPI Properties
Here you can enter the names of the properties in the event message that contains KPI values. These properties must exist in every input event.

You specify the property name in the message and a label that is used in the dashboard component:
Stage Events
If you want to get informed about stage related events, you can define them here:

You can select to fire events when a stage is created, a process is checked-in or -out.
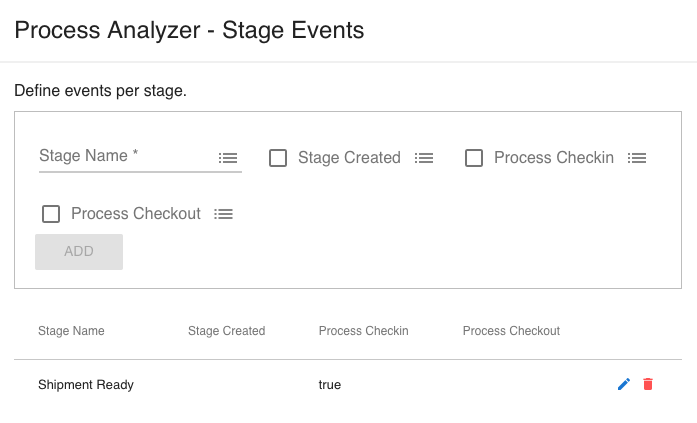
The Process Analyzer will send the events through its event output connector.
Link Events
If you want to get informed about link related events, you can define them here:

You can select to fire events when a link is created or a process is traveling this link.
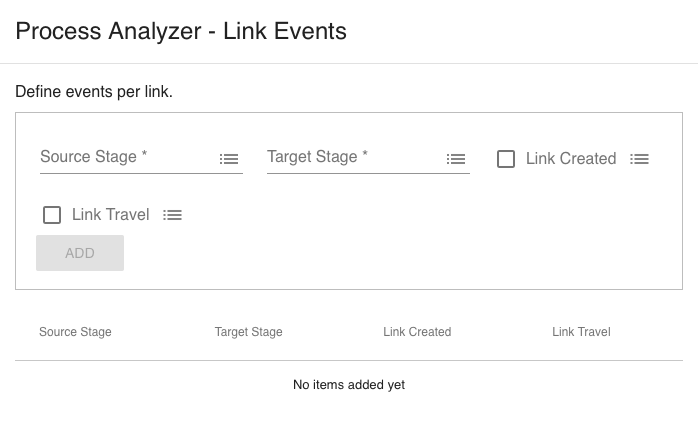
The Process Analyzer will send the events through its event output connector.
Alert Events
If you want to get informed when a process stays too long at specific stages, you can define alert events here:

You specify the stage name, threshold value, and unit. The dashboard component will show these alerts visually, and the Process Analyzer will send an alert event through its event output connector.
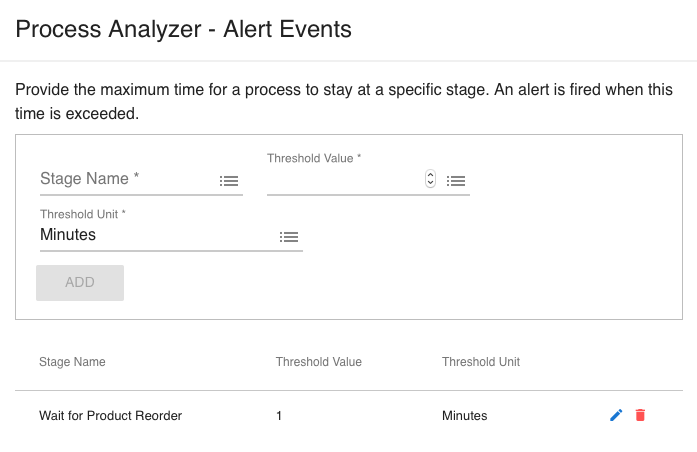
Stage Expiration
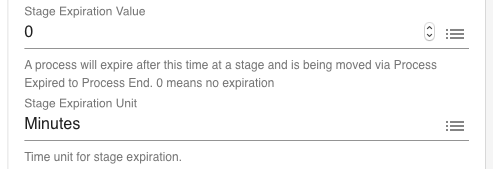
Sometimes processes may end after a specific time, no matter at which stage they are. In that case, you can define a stage expiration. When reaching that threshold, the process moves to stage Process Expiredand from there immediately to Process End.
Process Model History
The Process Analyzer automatically takes snapshots of the process model every 15 minutes and saves it persistently. The dashboard component can view these snapshots to view the process model at a particular point in time. The maximum days back in time is 10 (960 snapshots).

Update Interval
Here you can specify the interval in which updates are sent to the dashboard component. 10 seconds is the reasonable default.

Dynamic Configuration
The Process Analyzer component supports dynamic configuration via messages during runtime through this connector:
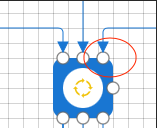
Messages sent to the configuration connector must have the following message properties set, dependent on the configuration event. You can send multiple messages for the same event type.
Configuration of Start Stages

Configuration of End Stages

Configuration of Stage Events

Configuration of Link Events

Configuration of Alerts

Configuration of Expiration

