Dashboard Orchestrator
The dashboard orchestrator is the central place to control and manage all your app dashboards within the whole connected SwiftMQ router network.
It is reachable from this menu:
General Layout
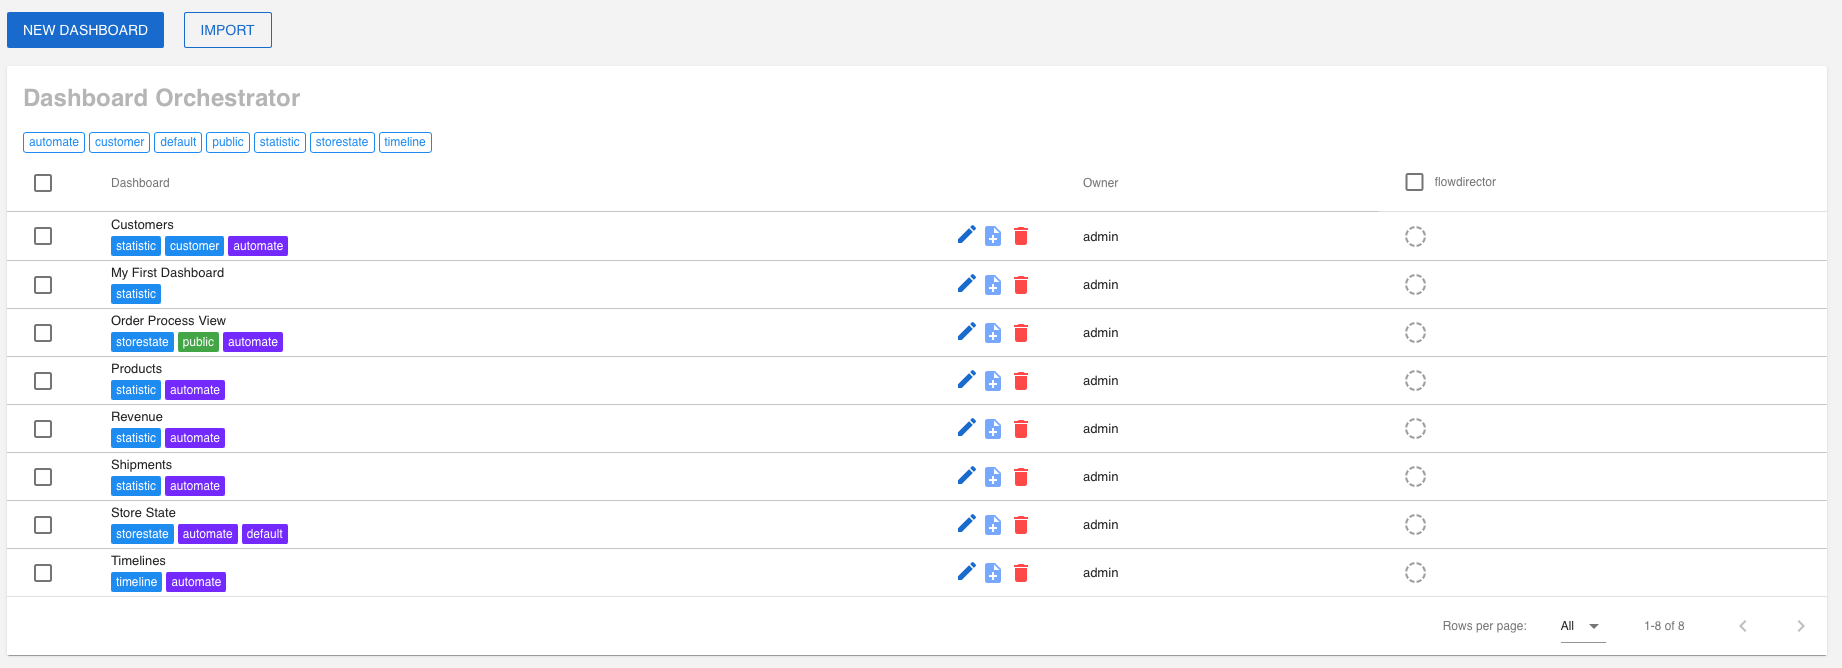
New Dashboard
Creates a new dashboard and launches the flow editor.
Tag Selector
Selects the rows (dashboard) to be displayed in the table. You can use multiple tags to select. Any dashboards that match all selected tags are displayed.
Rows
Each row represents a dashboard.
Each row has several buttons:
Edit: Launches the dashboard editor.
Copy: Copies this dashboard.
Delete: Deletes this dashboard.
Router Nodes
Display a column for each connected SwiftMQ router. These are the node where you can activate the dashboards.
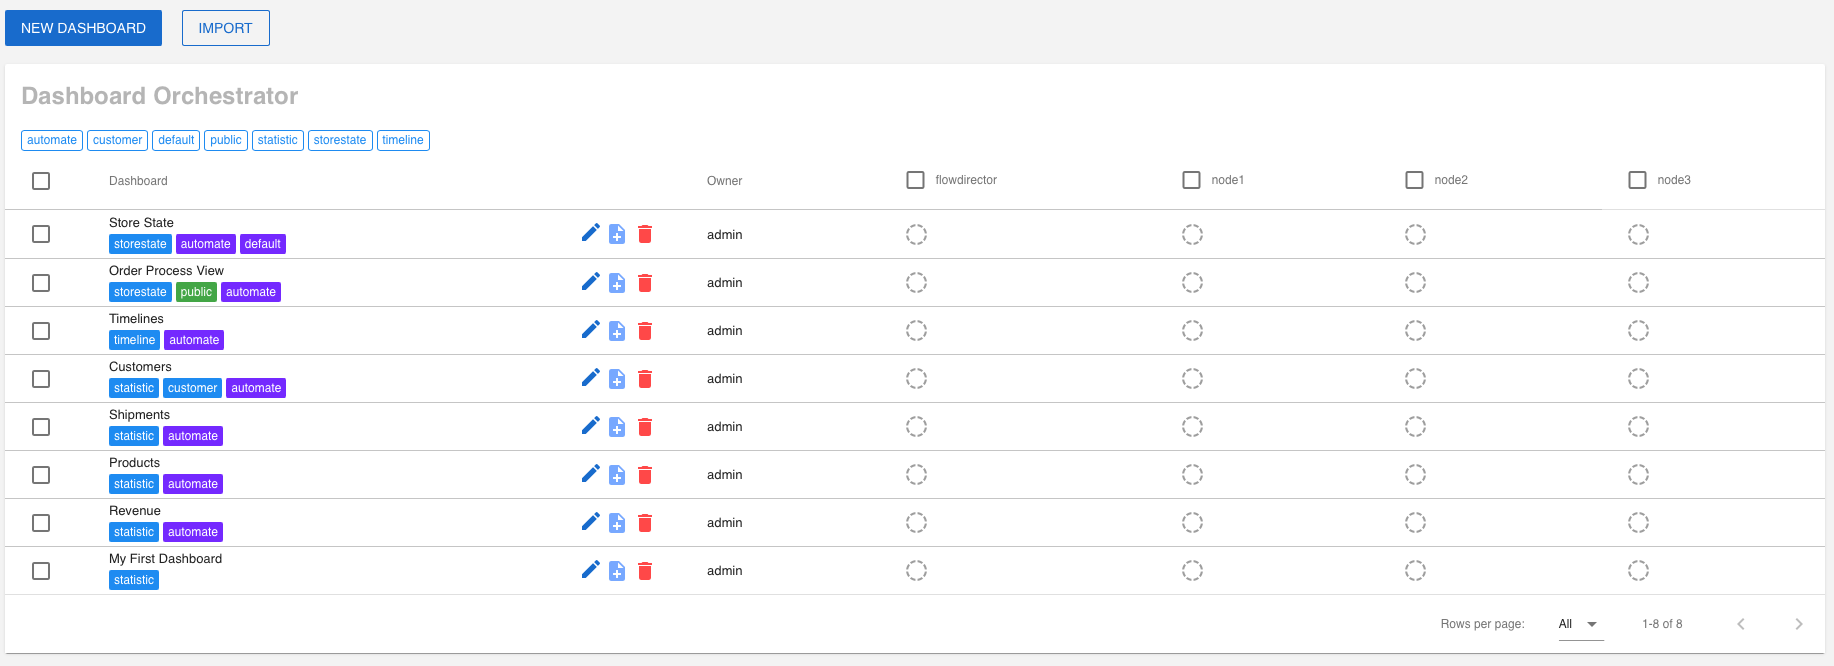
In the standard Flow Director distribution, you have a single node embedded SwiftMQ router with the name flowdirector. If you connect more routers, you will see them as columns and can use them as activation node:
Dashboard Operations
Activation/Deactivation
Operations on a dashboard can be executed by pointing the mouse at the dashboard/node combination cell. Click on it will toggle between deactivated and activated:

Activation means the dashboard is visible in a dynamic Router Network Menu under that particular node. Deactivation means it is removed from that menu. This takes place dynamically for all connected Flow Director clients.
Public Dashboards
A dashboard can be tagged with public. This generates a dedicated link to the dashboard and makes it accessible without a login to the app.
Public dashboards are intended to be shown on public terminals or in network operation centers. They can also be embedded in custom HTML pages via the <iframe> or <embed> tag. Therefore, it is possible to add this kind of dashboard as a widget to such a page, i.e., custom status pages.
Public dashboards have a different popup menu in their cells:
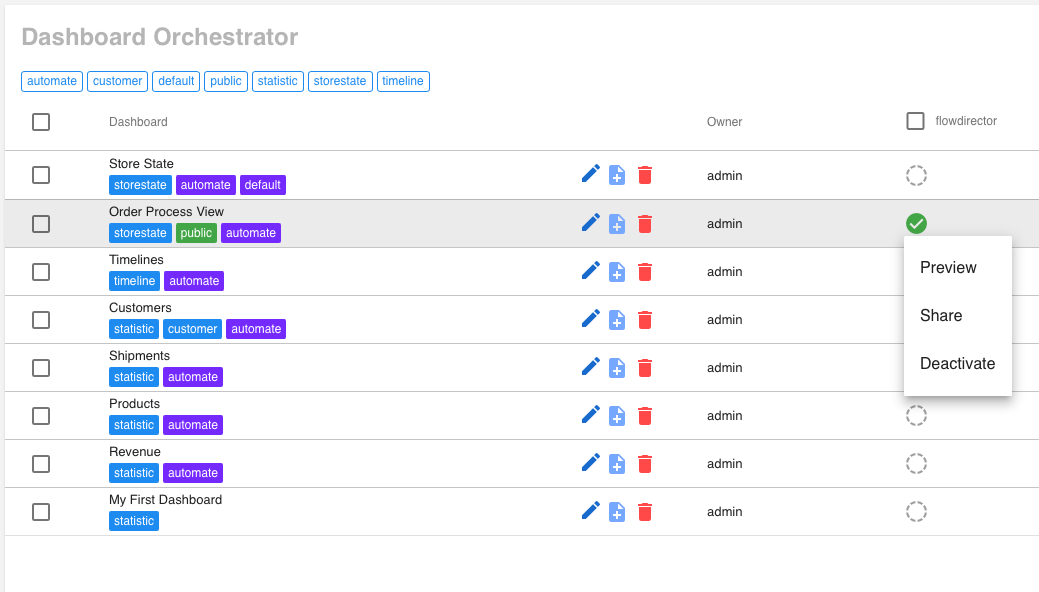
Preview
The dashboard is opened in a new window.
Share
The link to the dashboard is copied to the clipboard.
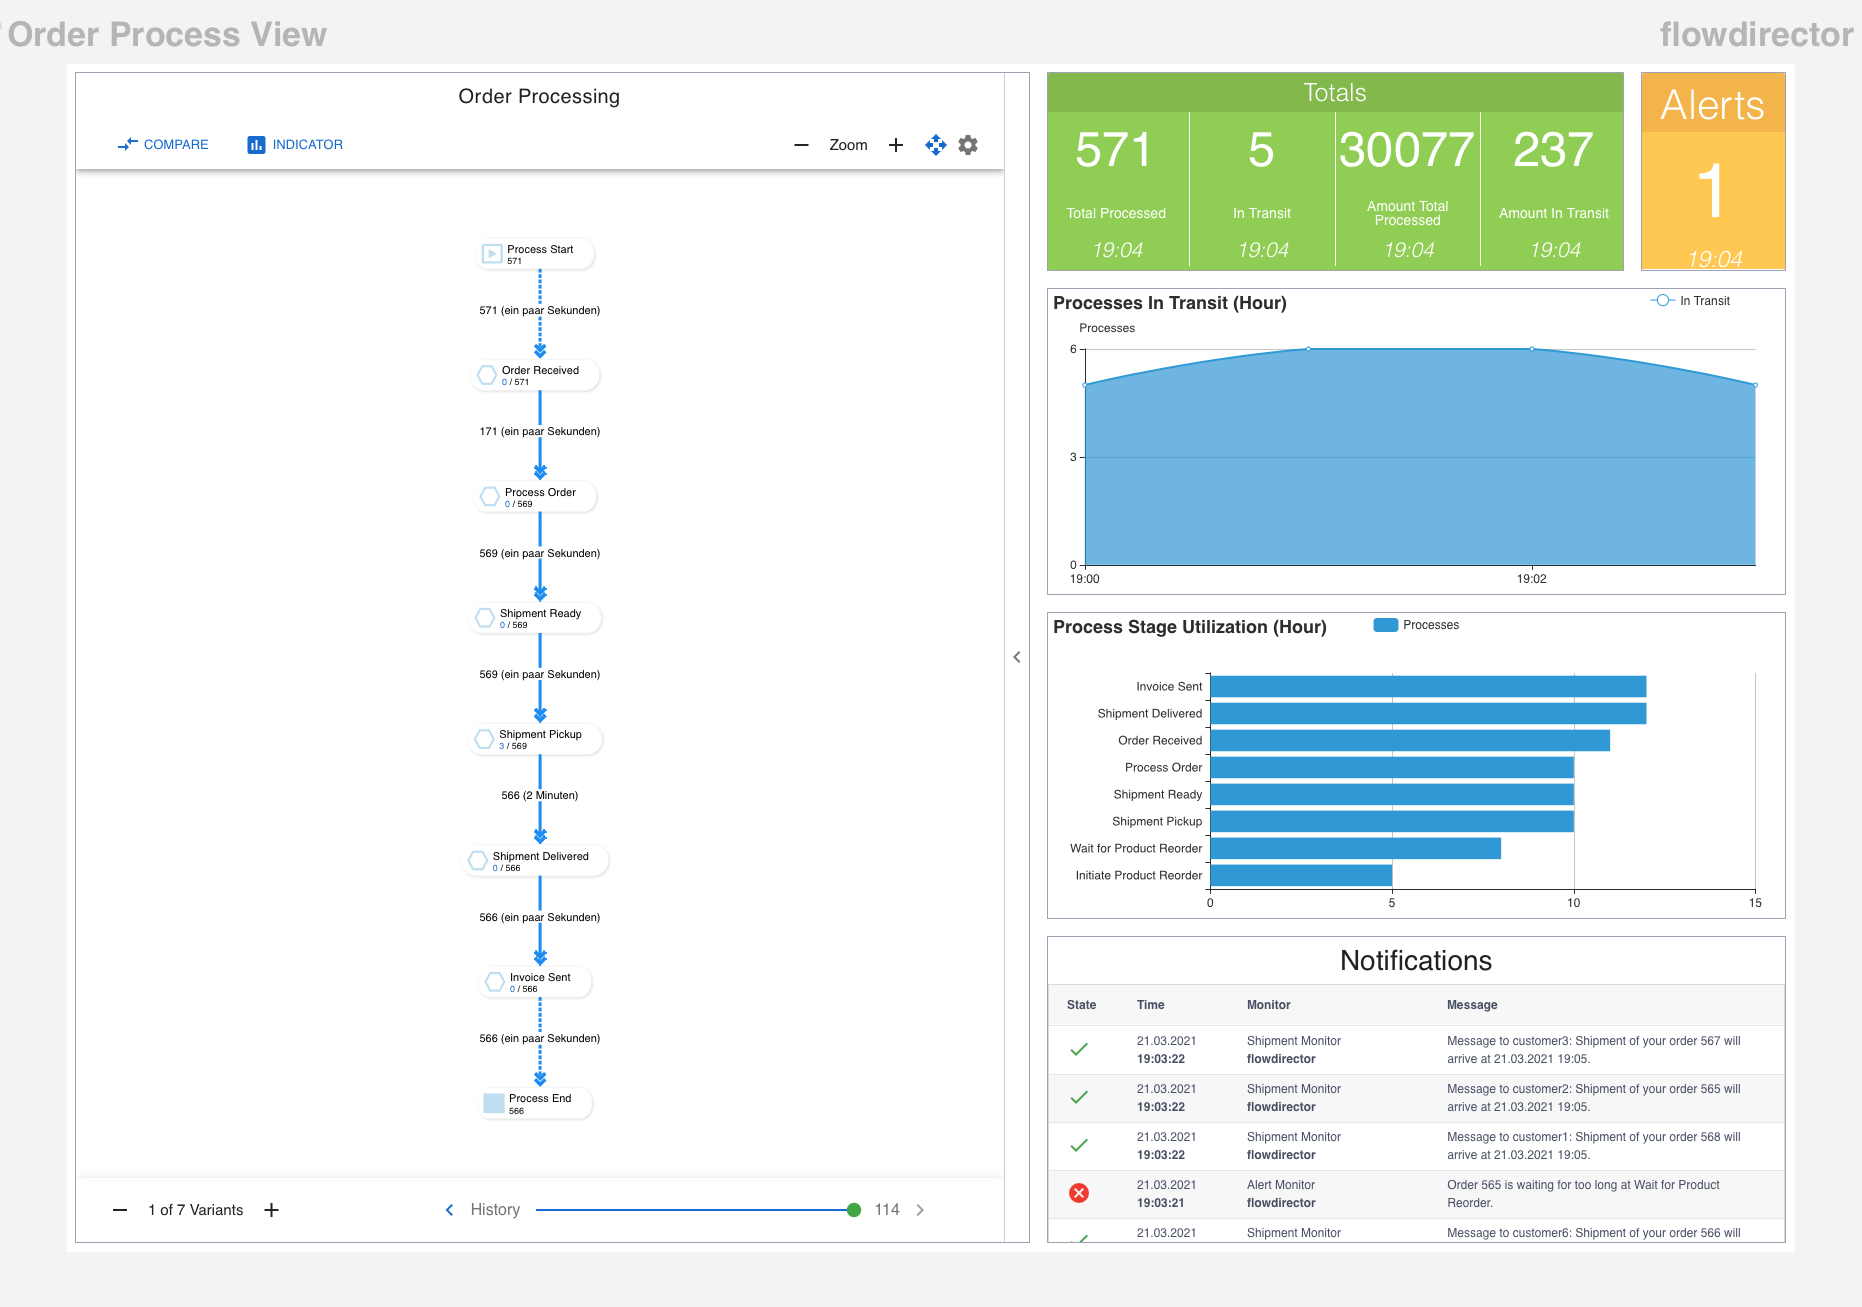
A public dashboard is shown as below with the dashboard name at the left and the router name on the right but without an app toolbar:
