Dashboard Editor
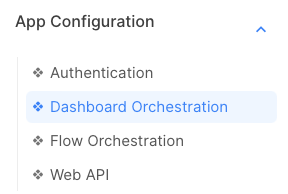
To create or edit dashboards, invoke the dashboard editor from the dashboard orchestrator, reachable from this menu:
It shows you the dashboard orchestrator of this app:
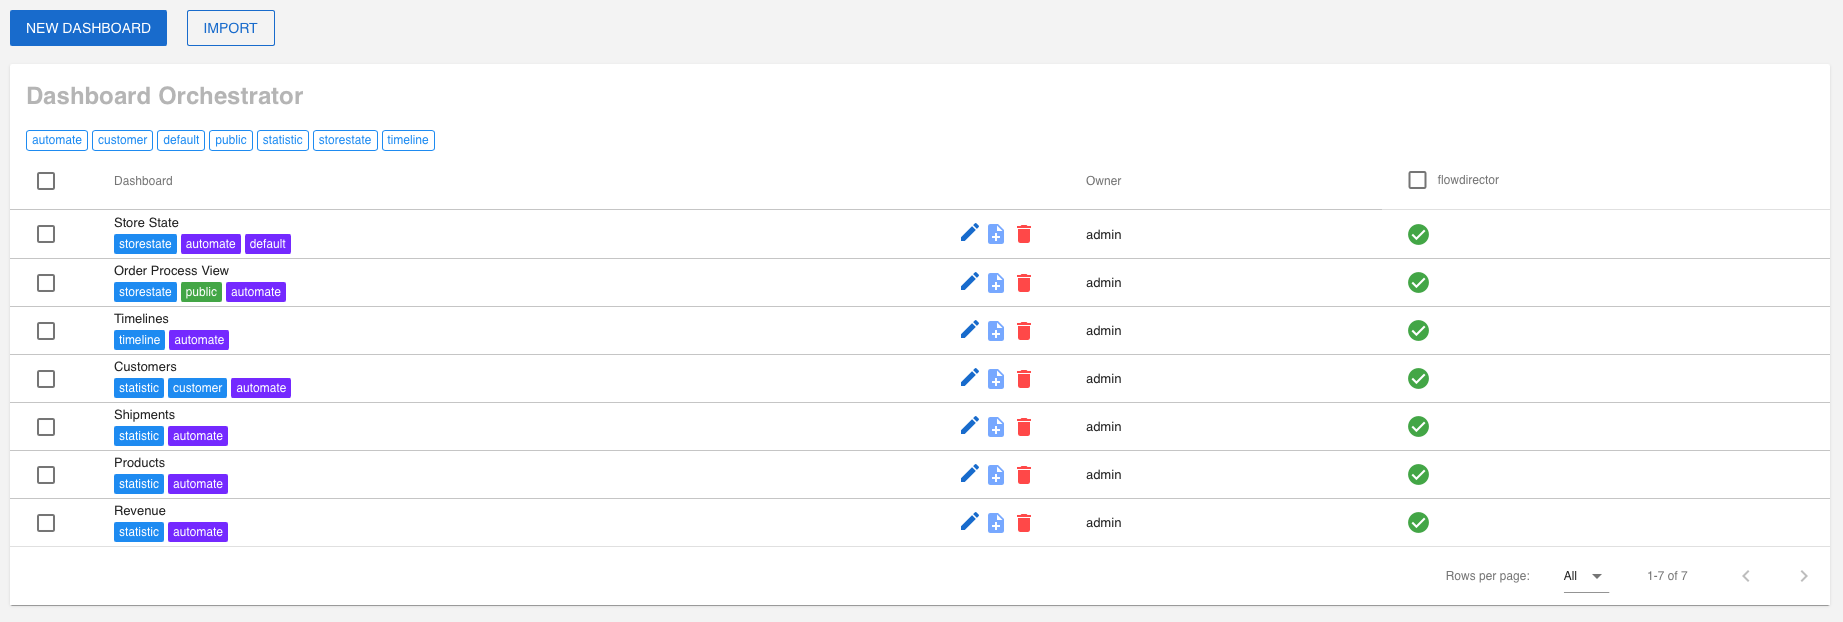
Remember that you need to start the flows that produce dashboard streams to connect them to visual dashboard components.
Create a Dashboard
To create a new dashboard, click on NEW DASHBOARD. To edit an existing dashboard, click on the pencil button of the particular dashboard row. Both launch the dashboard editor:
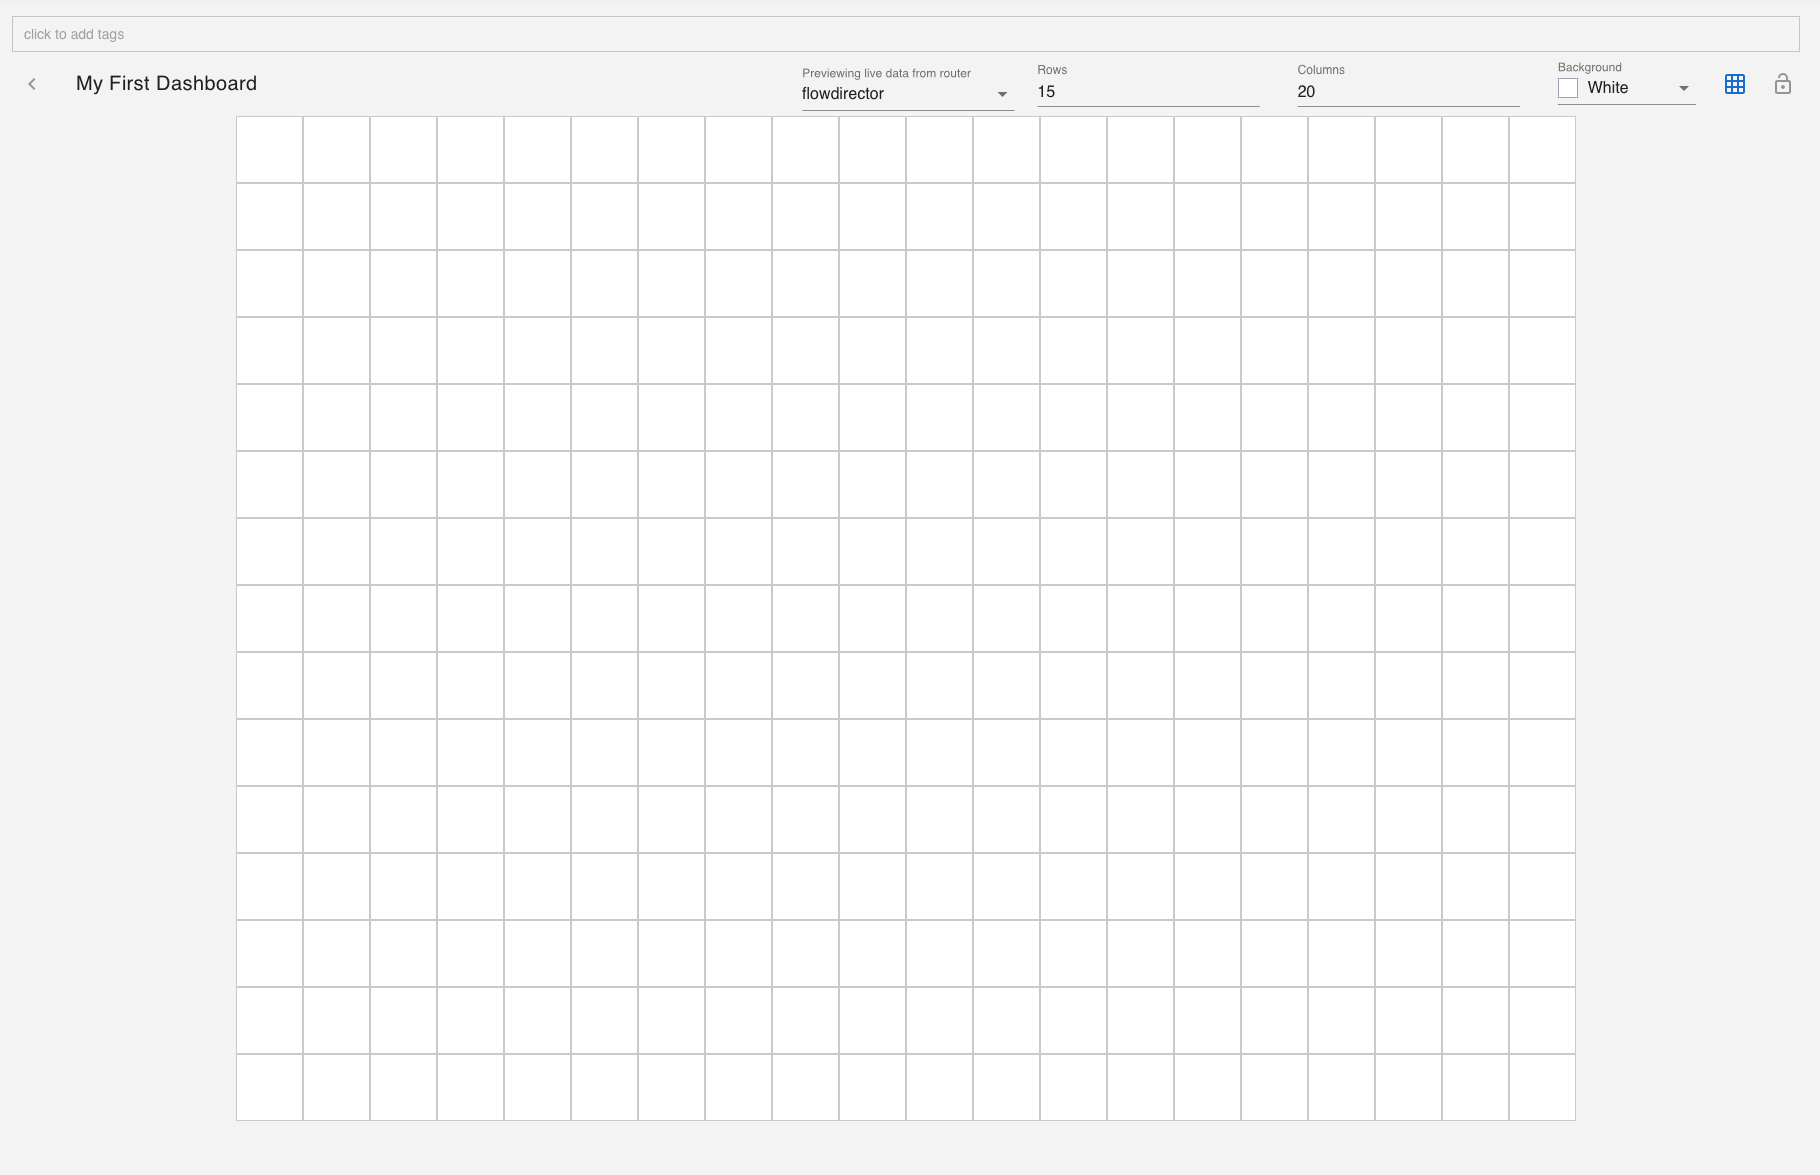
To create a dashboard component, select the area you want to put this element with the mouse by holding and dragging it:
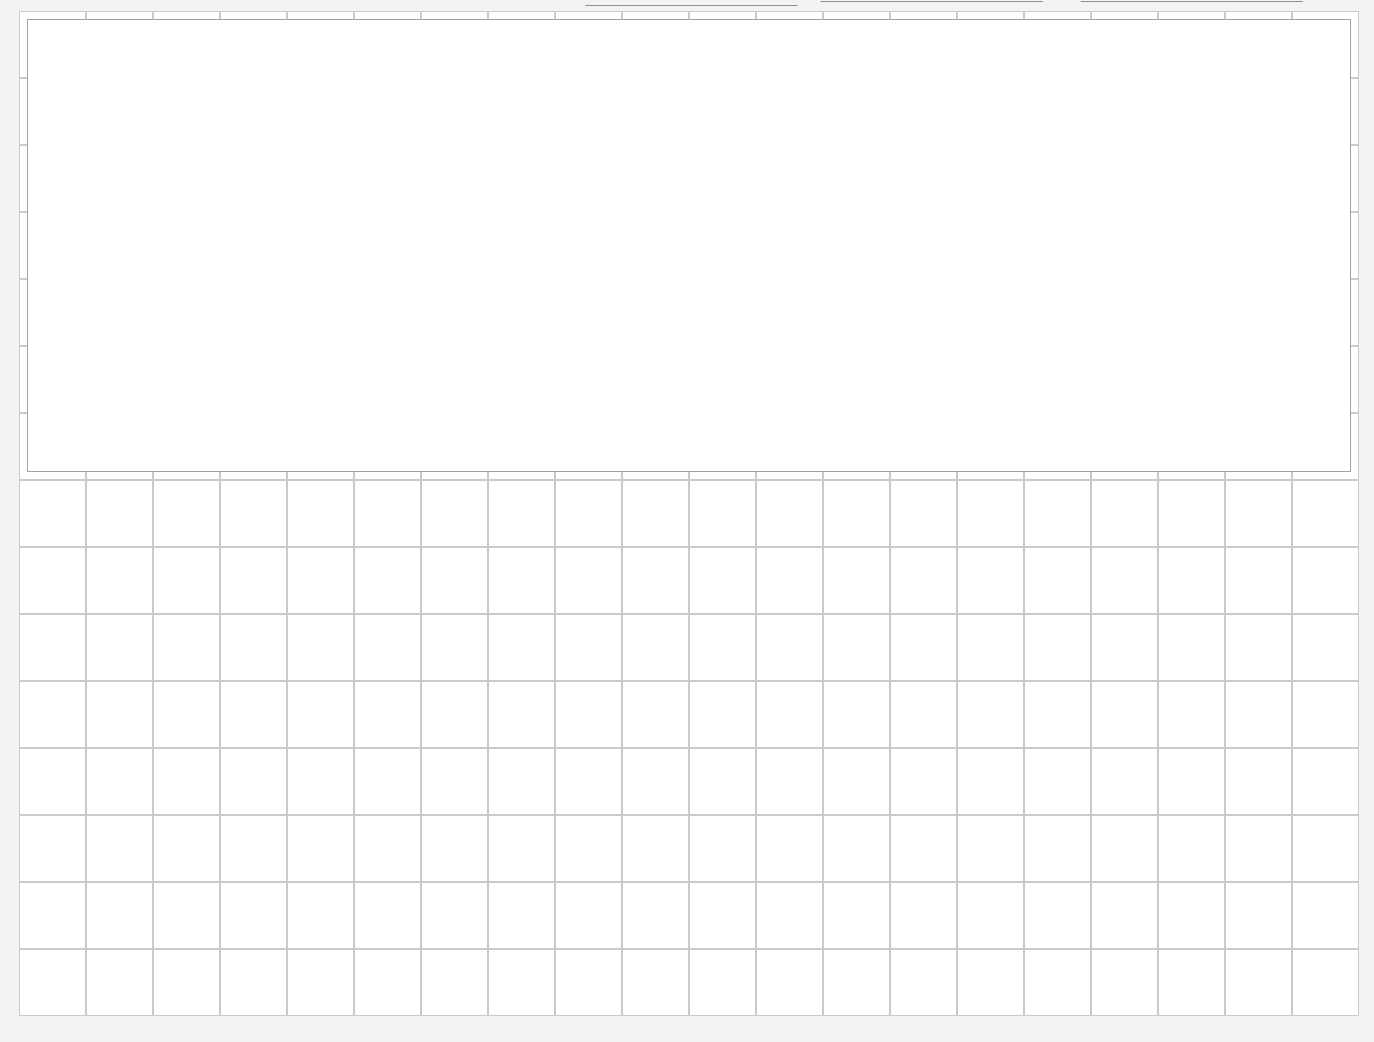
Then click on the upper right corner of that element to edit it:

It displays the component selector. Select the component you want to display and click CONTINUE:
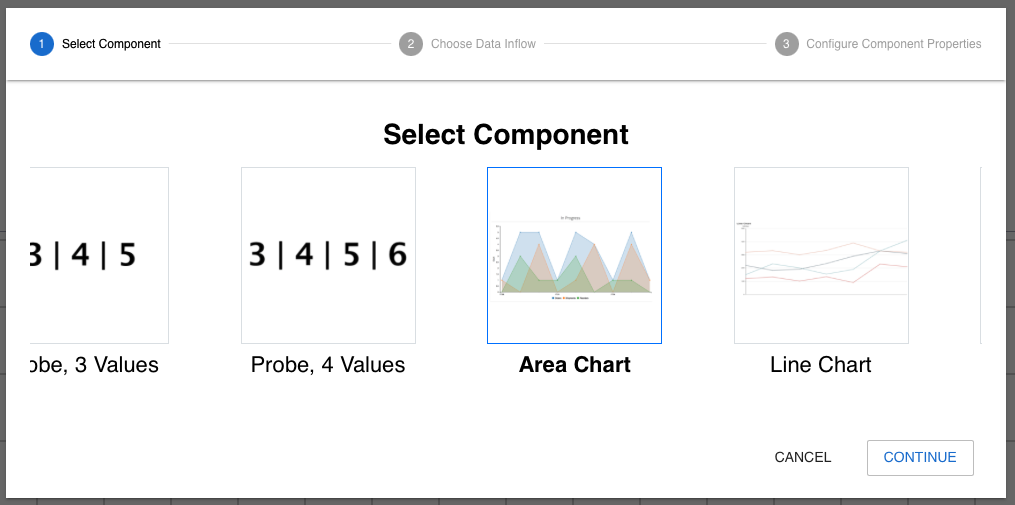
We chose an area chart and now define the data inflow. Again, this requires the flows that produce dashboard streams to be active.
Every dashboard item must have a data inflow/source router specified. The router can either be a static router or a dynamic router.
A dynamic router will allow the dashboard item to retrieve its data from whichever router is being viewed.
If you specify a router for the dashboard item, it will always look to the given router even when accessed under different routers in the navigation menu.
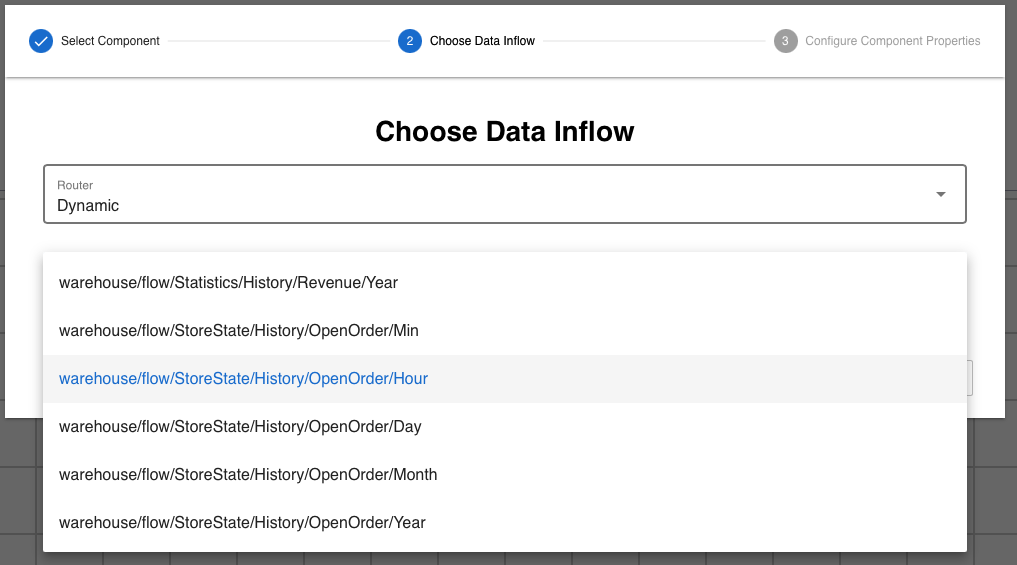
The Streams Listbox list all streams that match this chart type. Chose one of them and click CONTINUE:
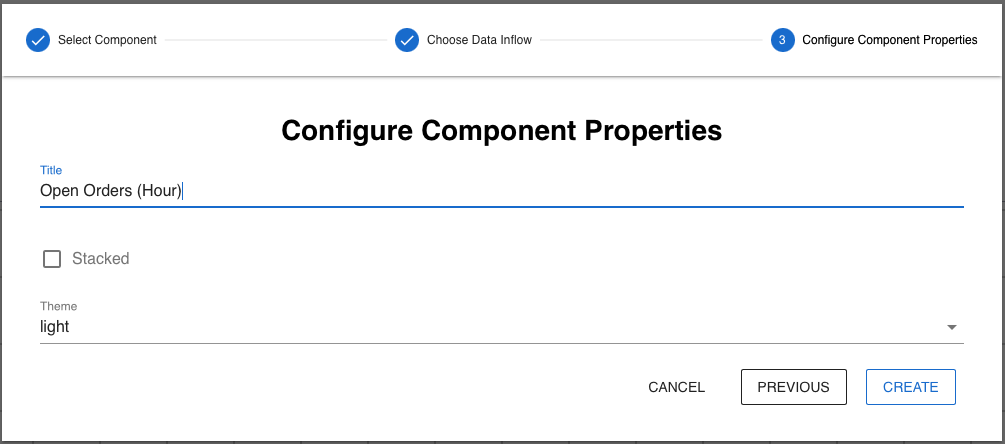
The last step is to configure the component properties. For the area chart, we define a title. Then click CREATE and the component is created:
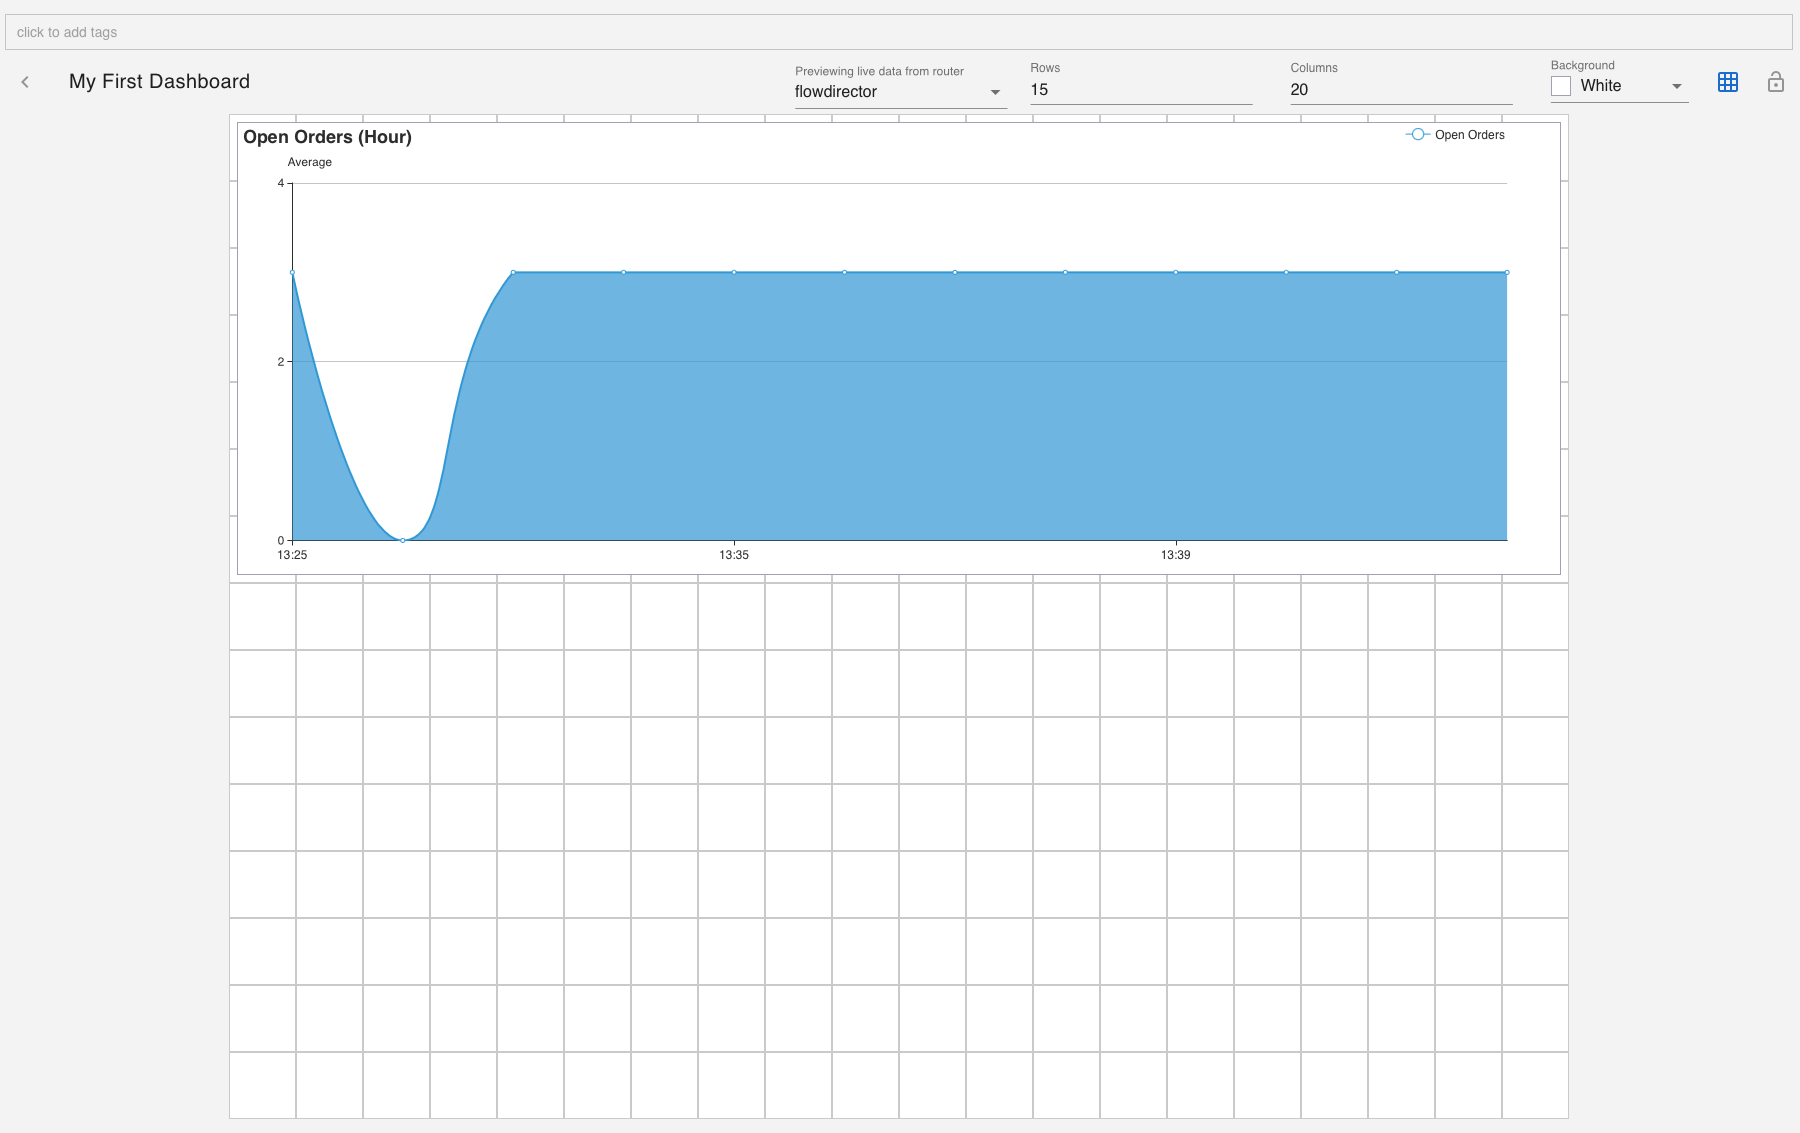
You already see live data displayed from the router selected in the upper “Preview live data from” list box.
You can create more components and resize it to your need.
Tag a Dashboard
To display a dashboard in the app menu, you need to tag the dashboard. We will use statistic as our tag:
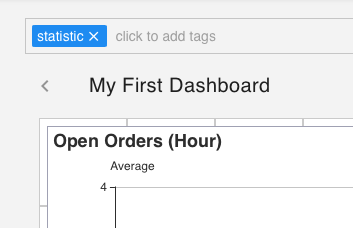
This ensures that it is displayed under a “Dashboard with Tag Selector” menu node that has this tag defined.
